
Juveniles in River
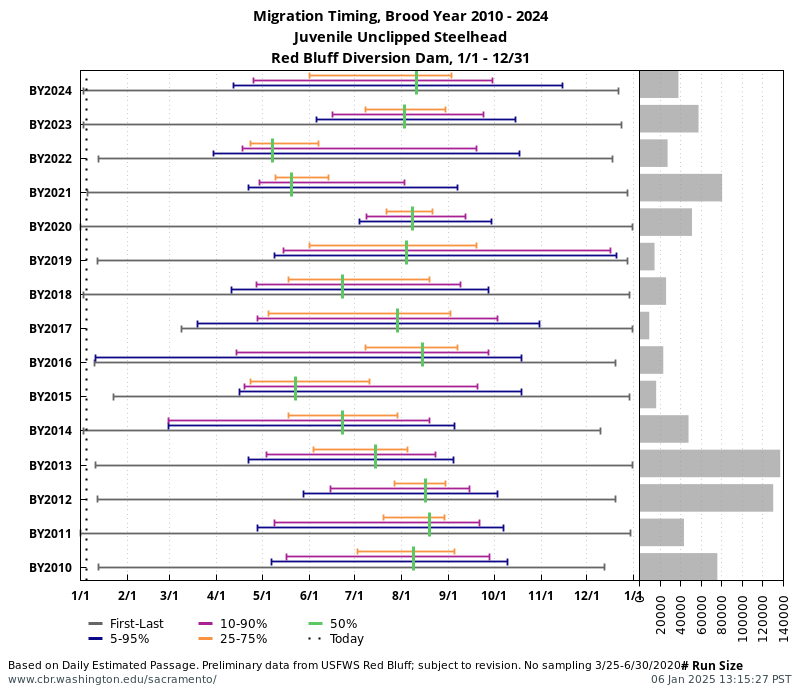
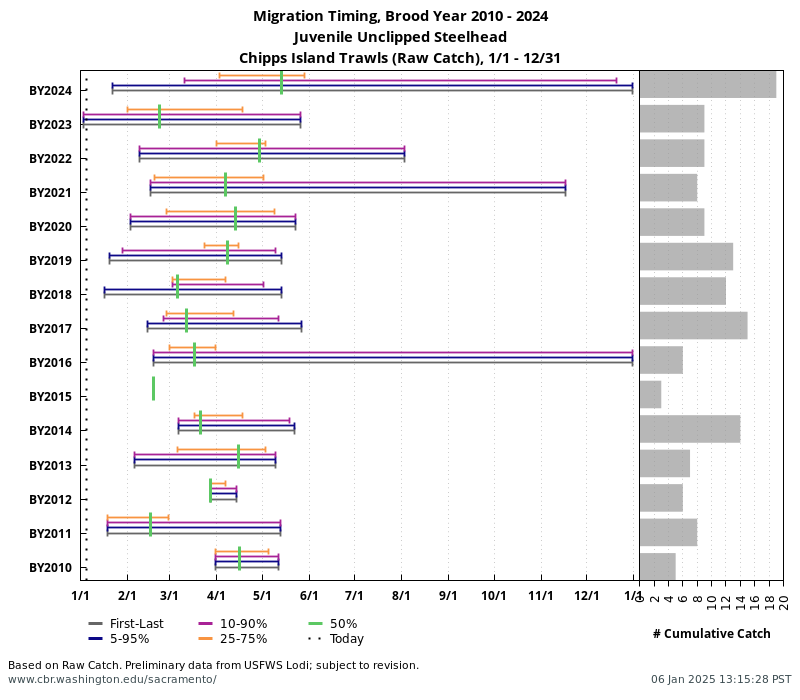
Migration Timing — annual data
Today Percent
| Species | Red Bluff Diversion Dam | Tisdale RST | Knights Landing RST | Sac Trawl (Sherwood) Catch Index | Chipps Island Trawl Catch Index | Salvage |
|---|---|---|---|---|---|---|
| Steelhead, Unclipped (January-December) | 2.8% (1.3%,4.3%) BY: 2015 - 2025 |
51.0% (30.8%,71.1%) BY: 2015 - 2025 |
51.8% (34.5%,69.1%) BY: 2015 - 2025 |
58.7% (37.1%,80.3%) BY: 2015 - 2025 |
45.1% (28.4%,61.9%) BY: 2015 - 2025 |
|
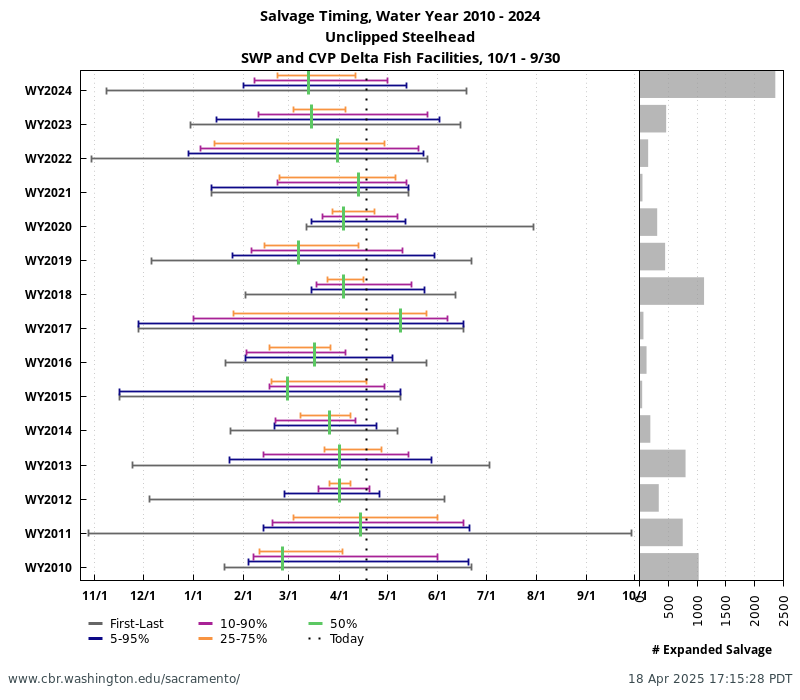
| Steelhead, Unclipped (Water Year) | 45.8% (31.6%,60.0%) WY: 2016 - 2025 |
Calculations generated by SacPAS Migration Timing and Conditions by Cohort and Salvage Timing. Data Courtesy of USFWS, Red Bluff; CDFW via StreamNet and CDEC; USFWS, Lodi.
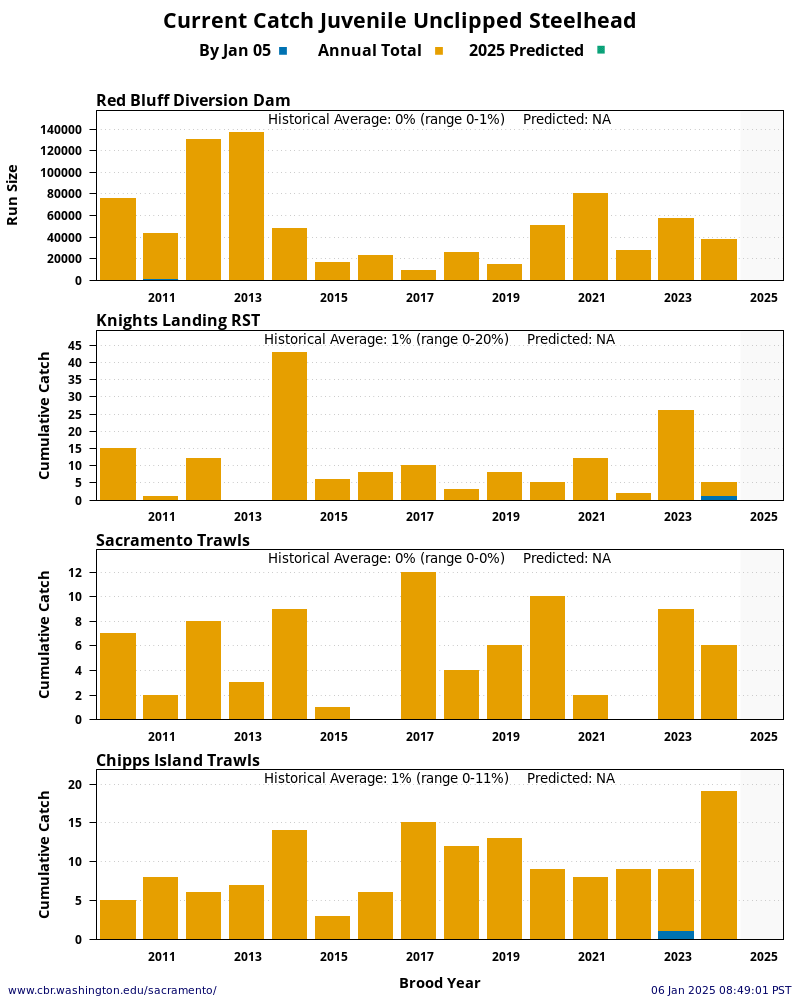
Current Catch
Juveniles in Delta
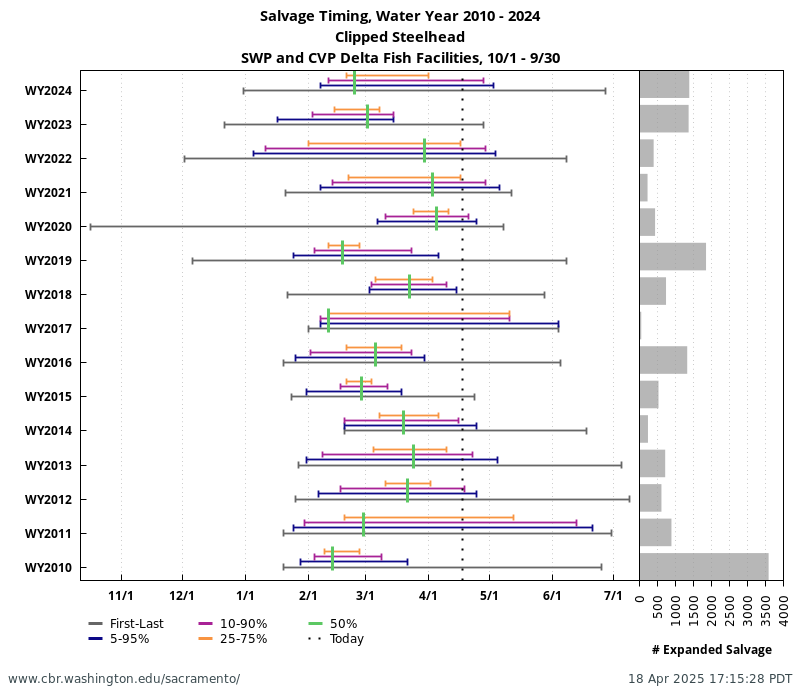
Salvage Timing — annual data
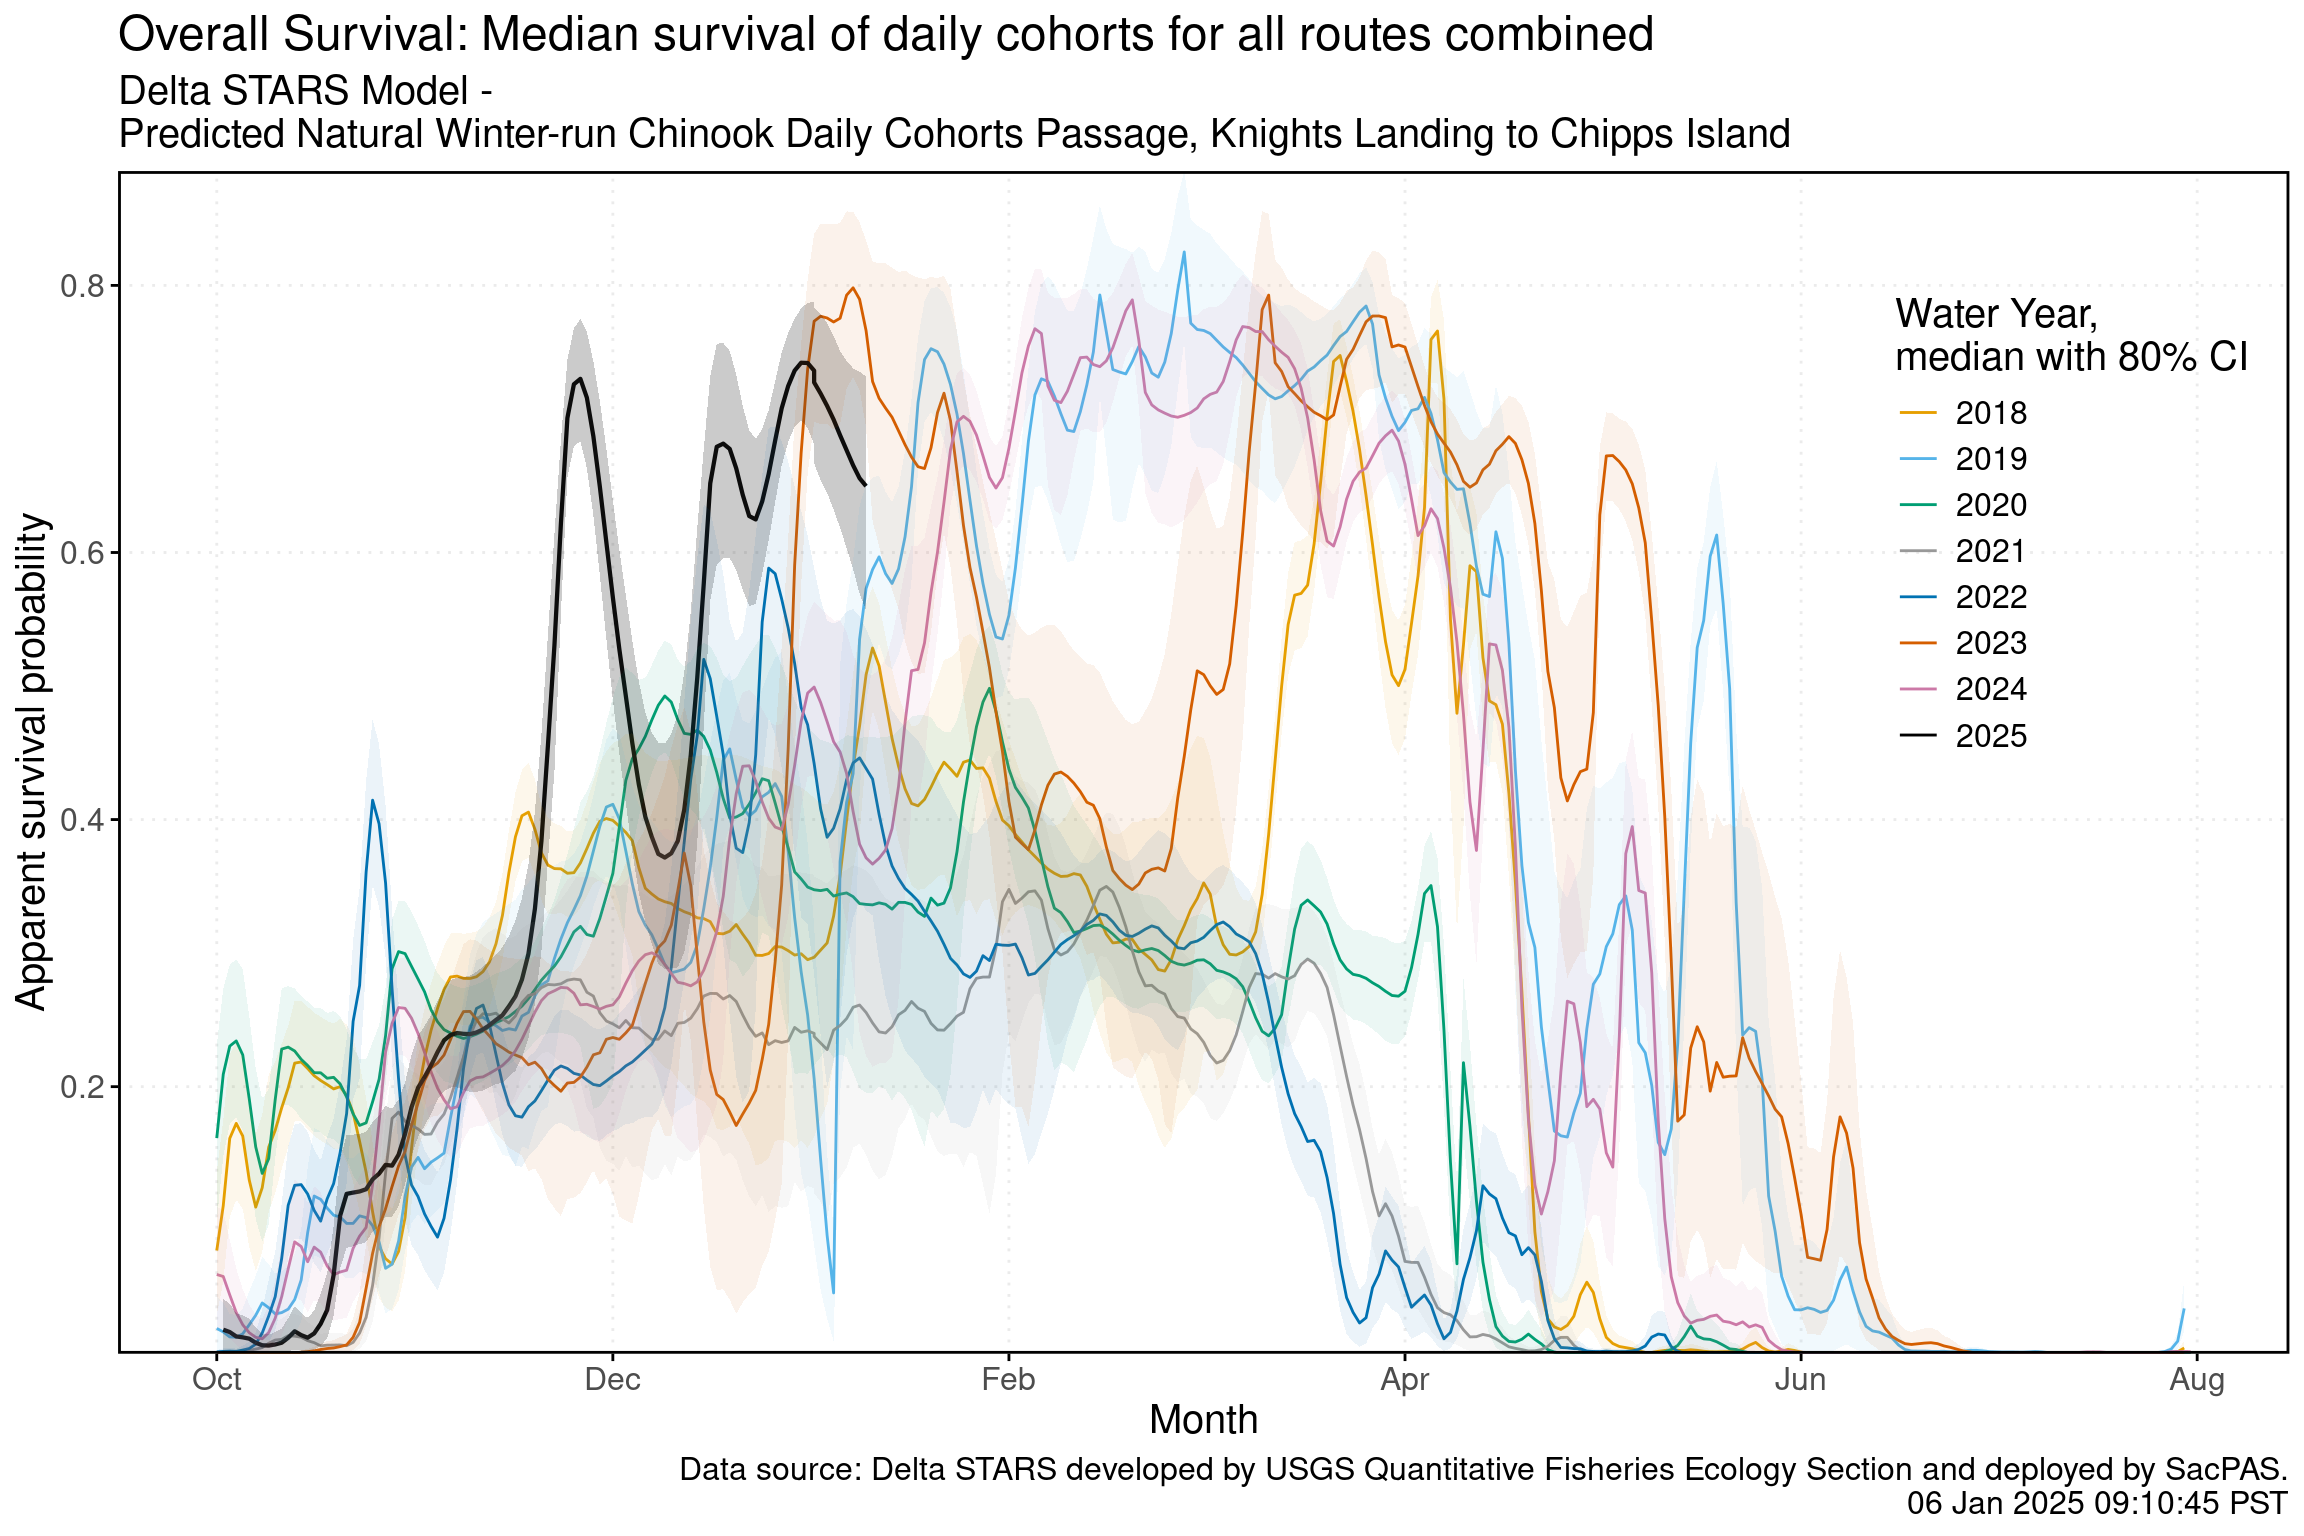
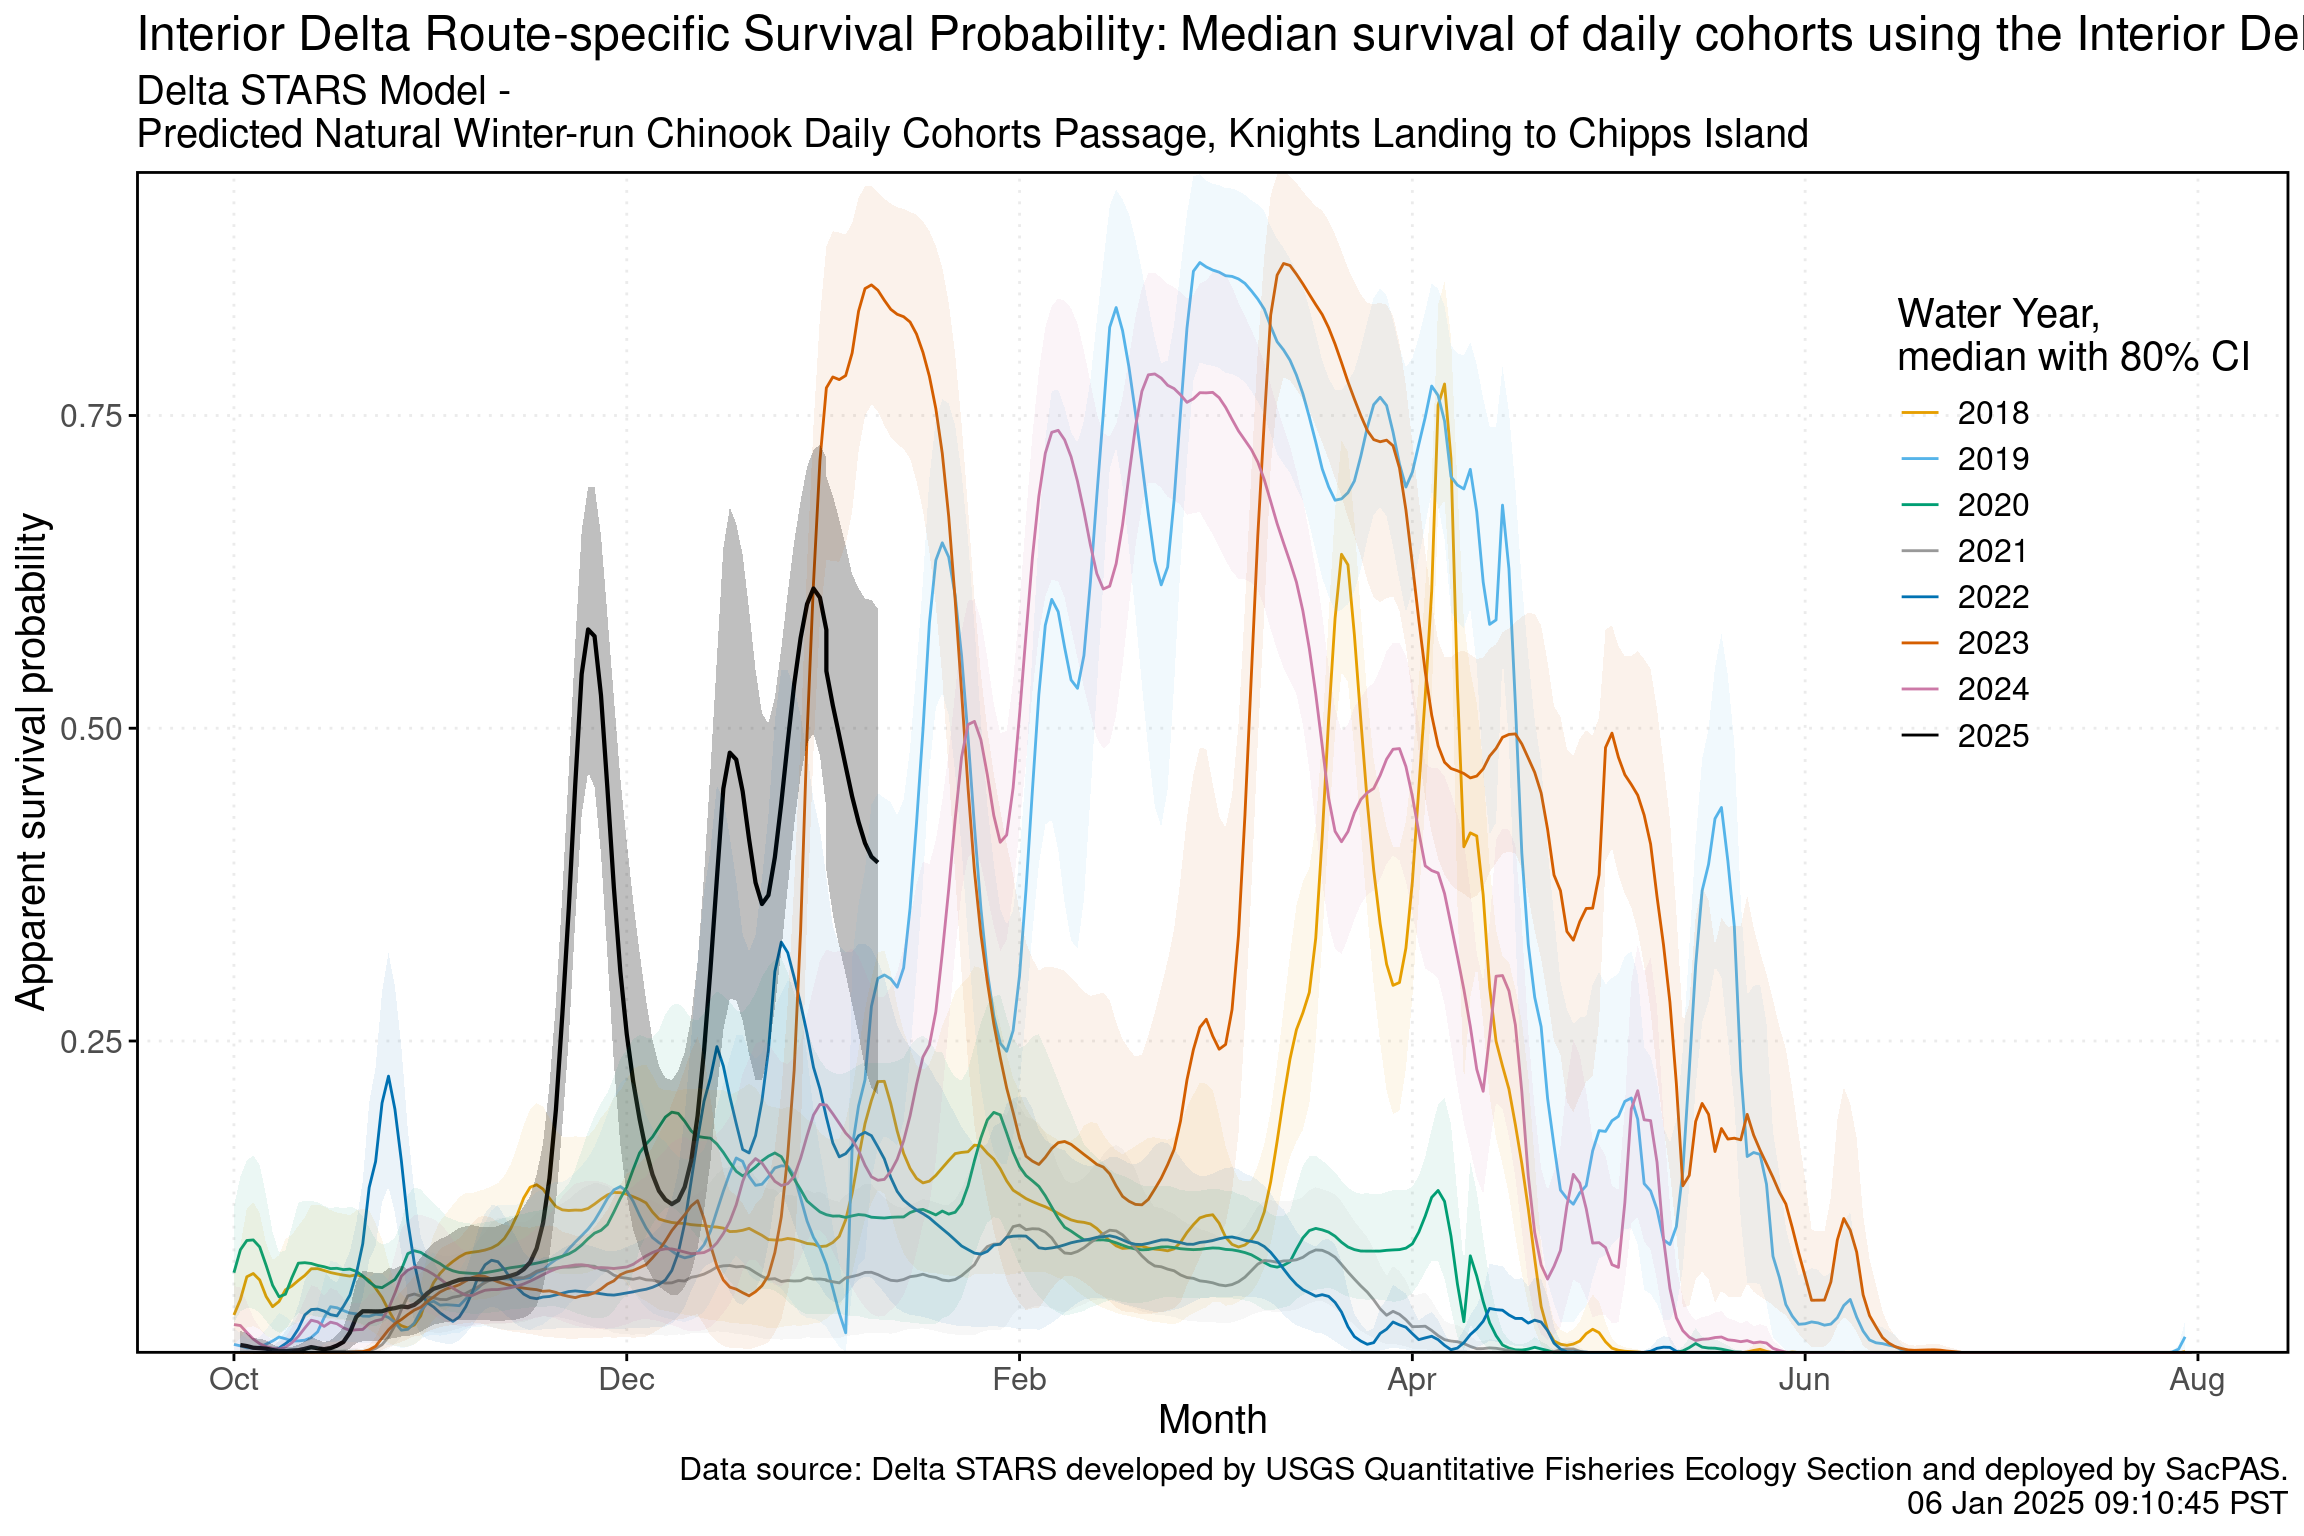
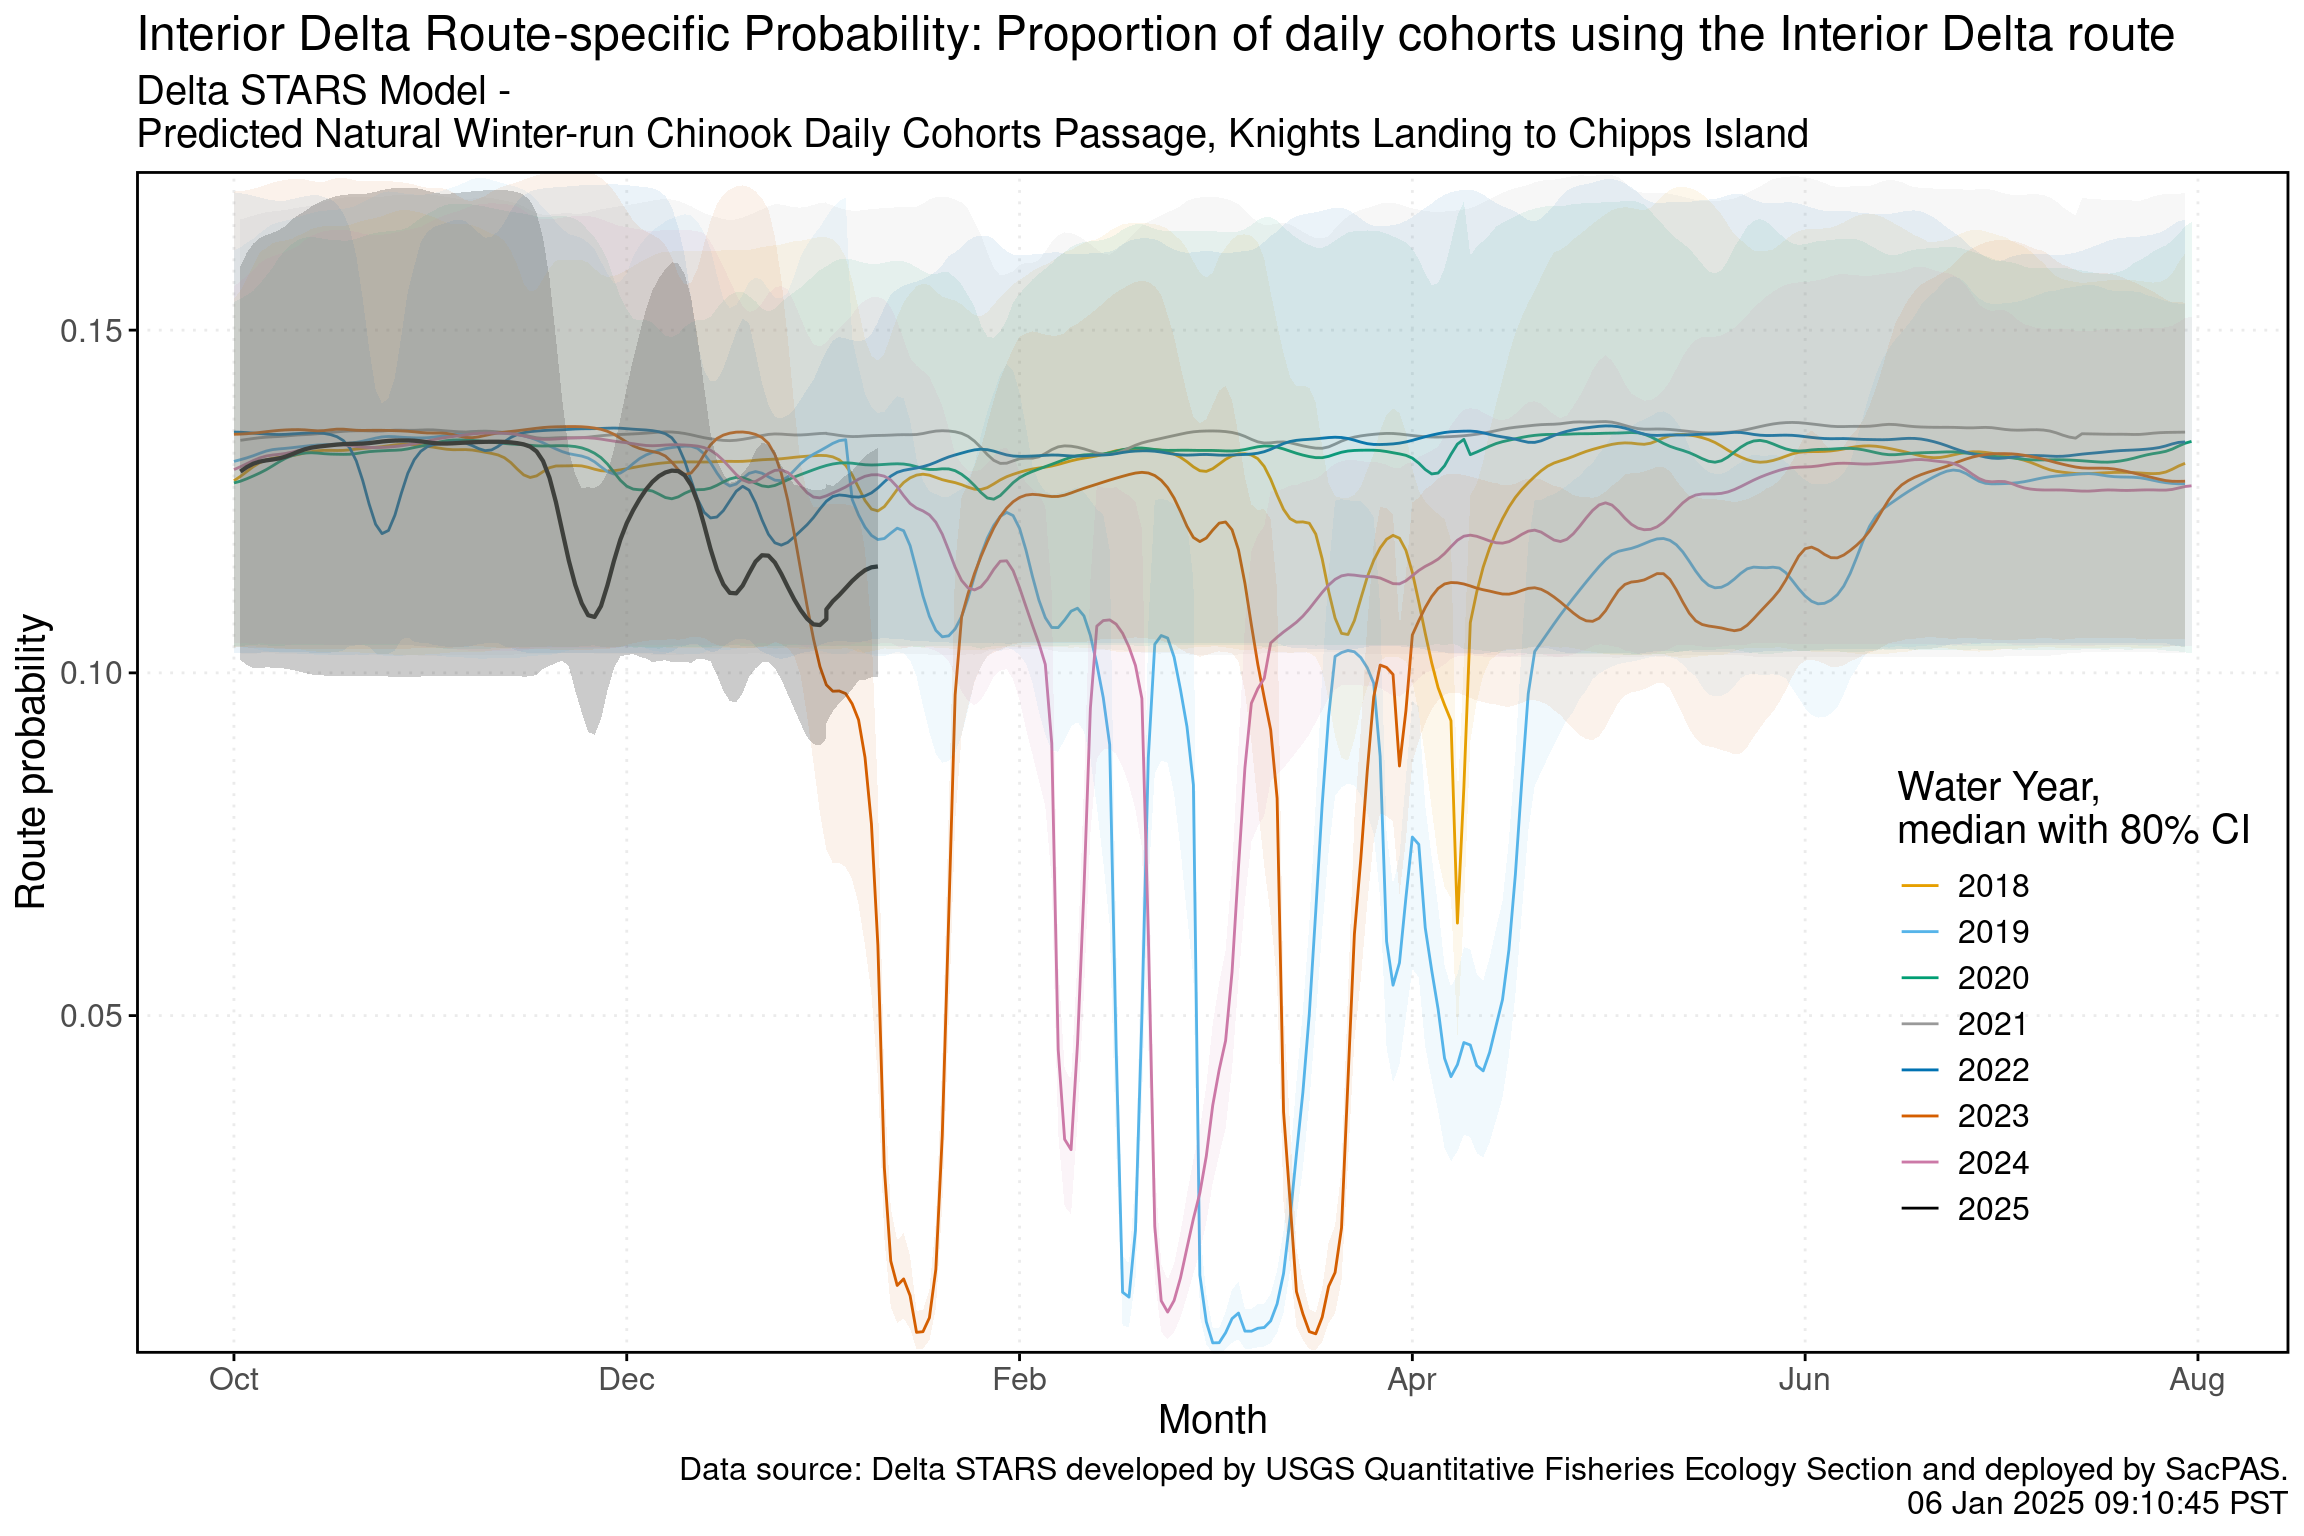
Delta STARS Survival and Routing Probabilities
Winter-run Chinook presented as surrogate for Steelhead
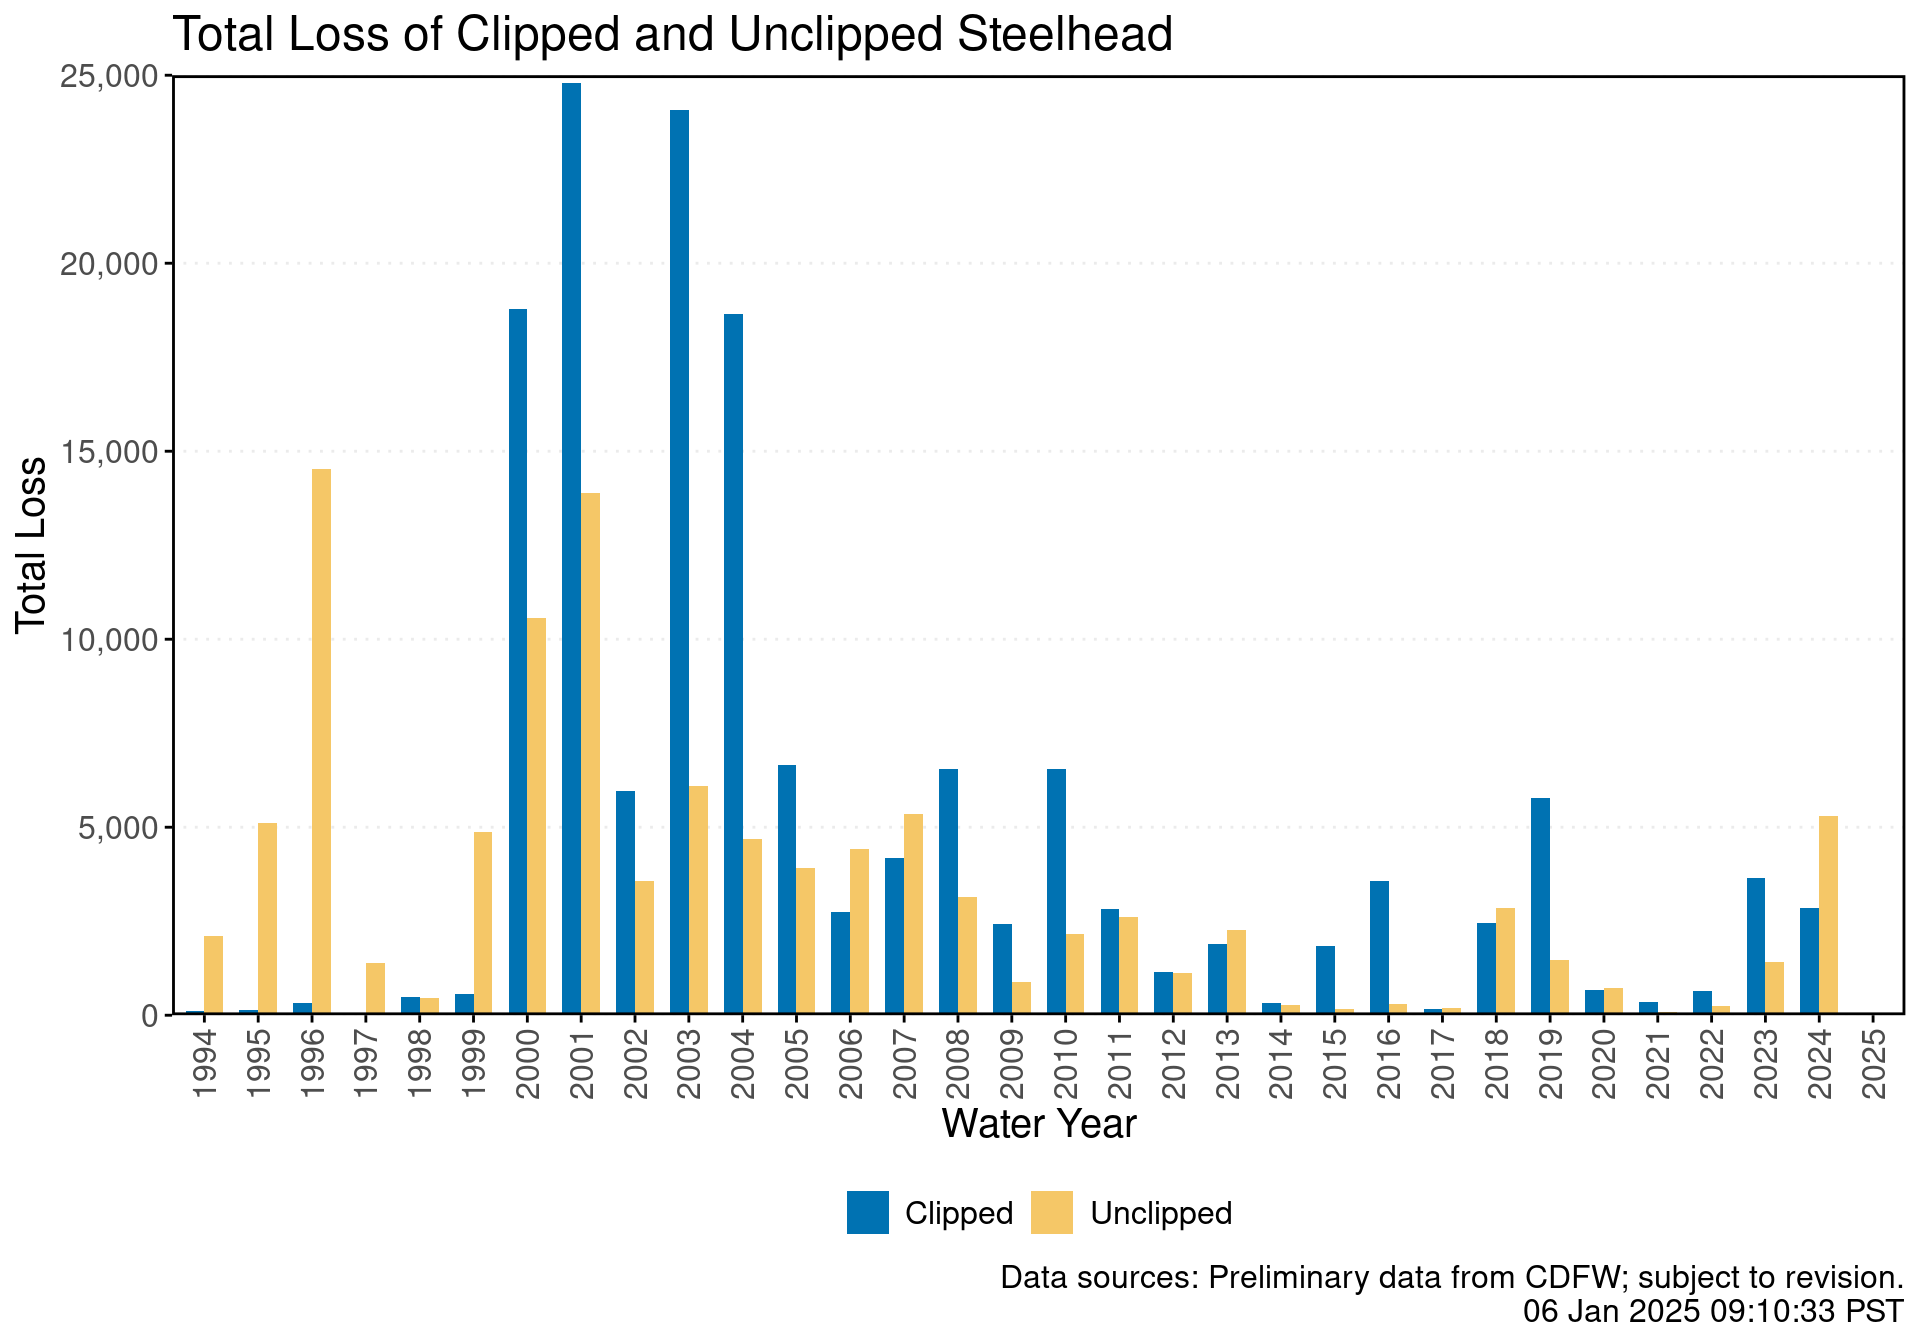
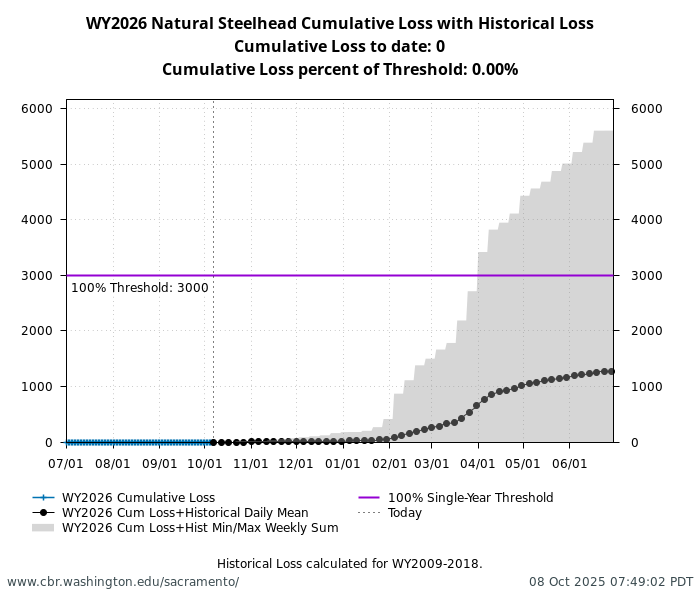
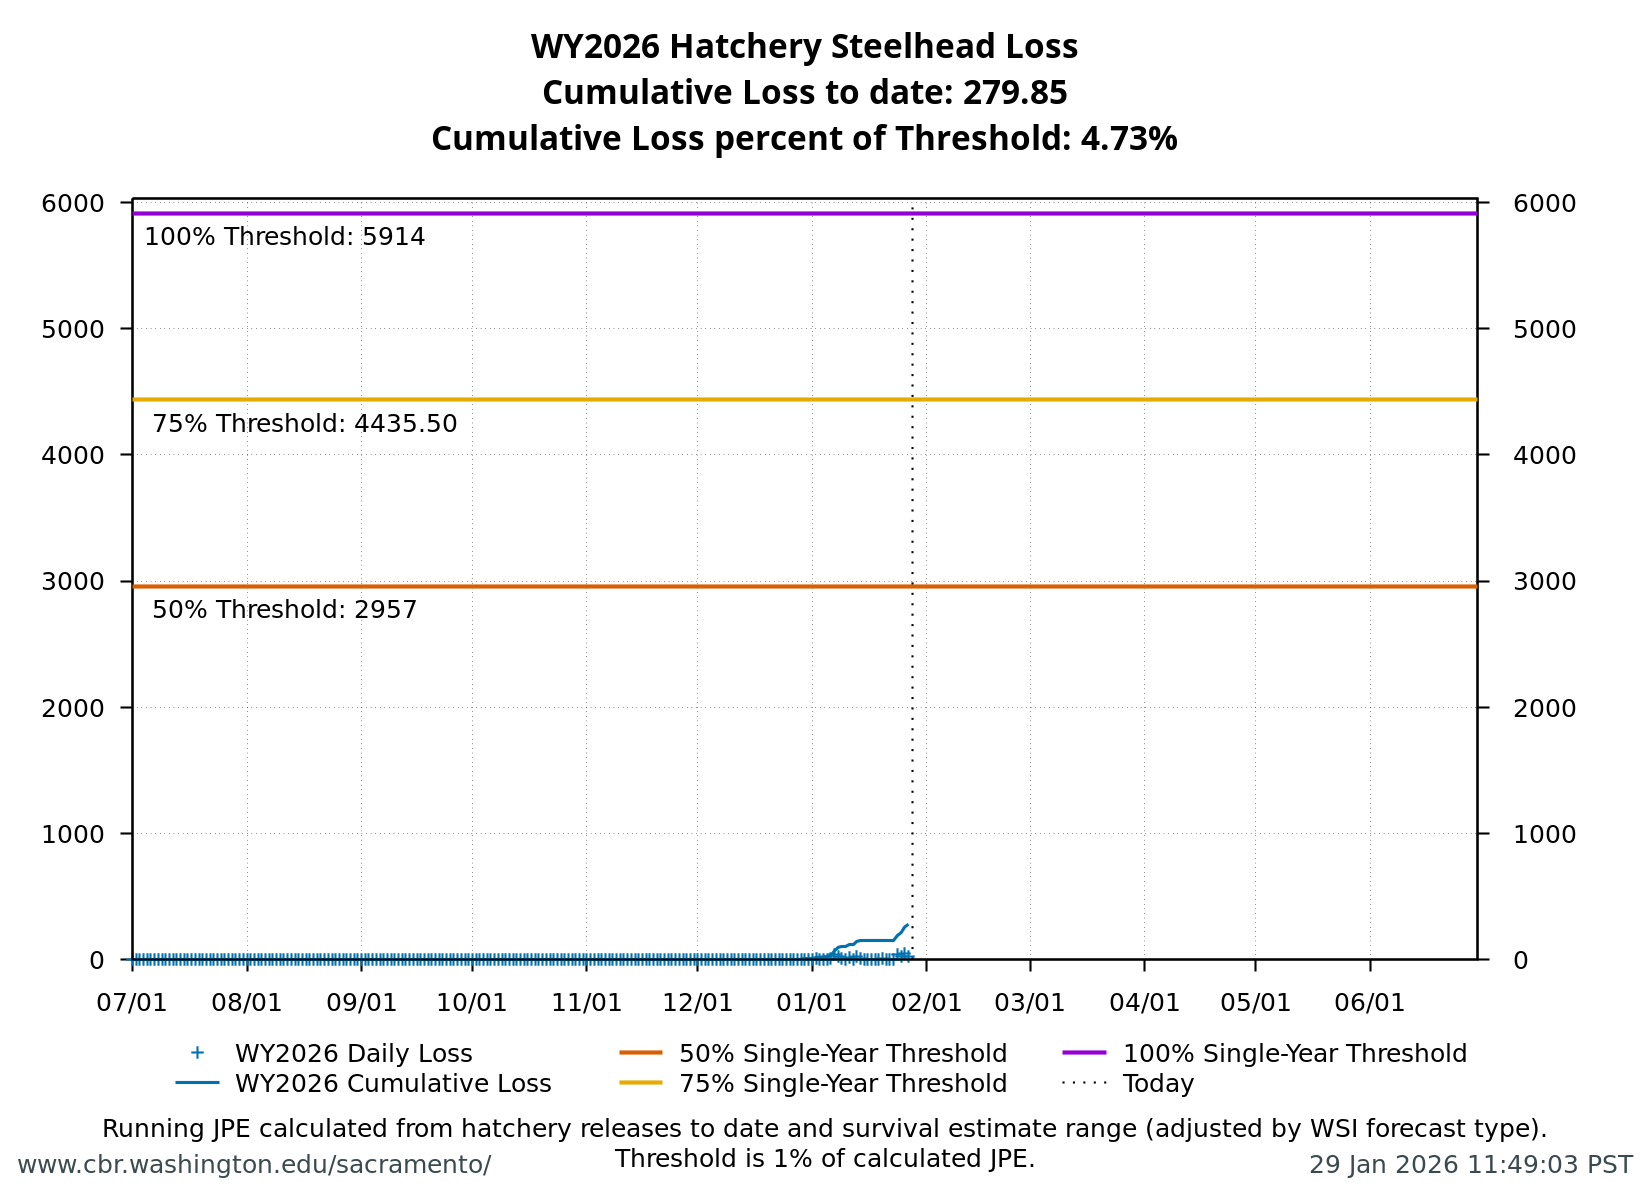
Total Loss — Clipped and Unclipped Steelhead
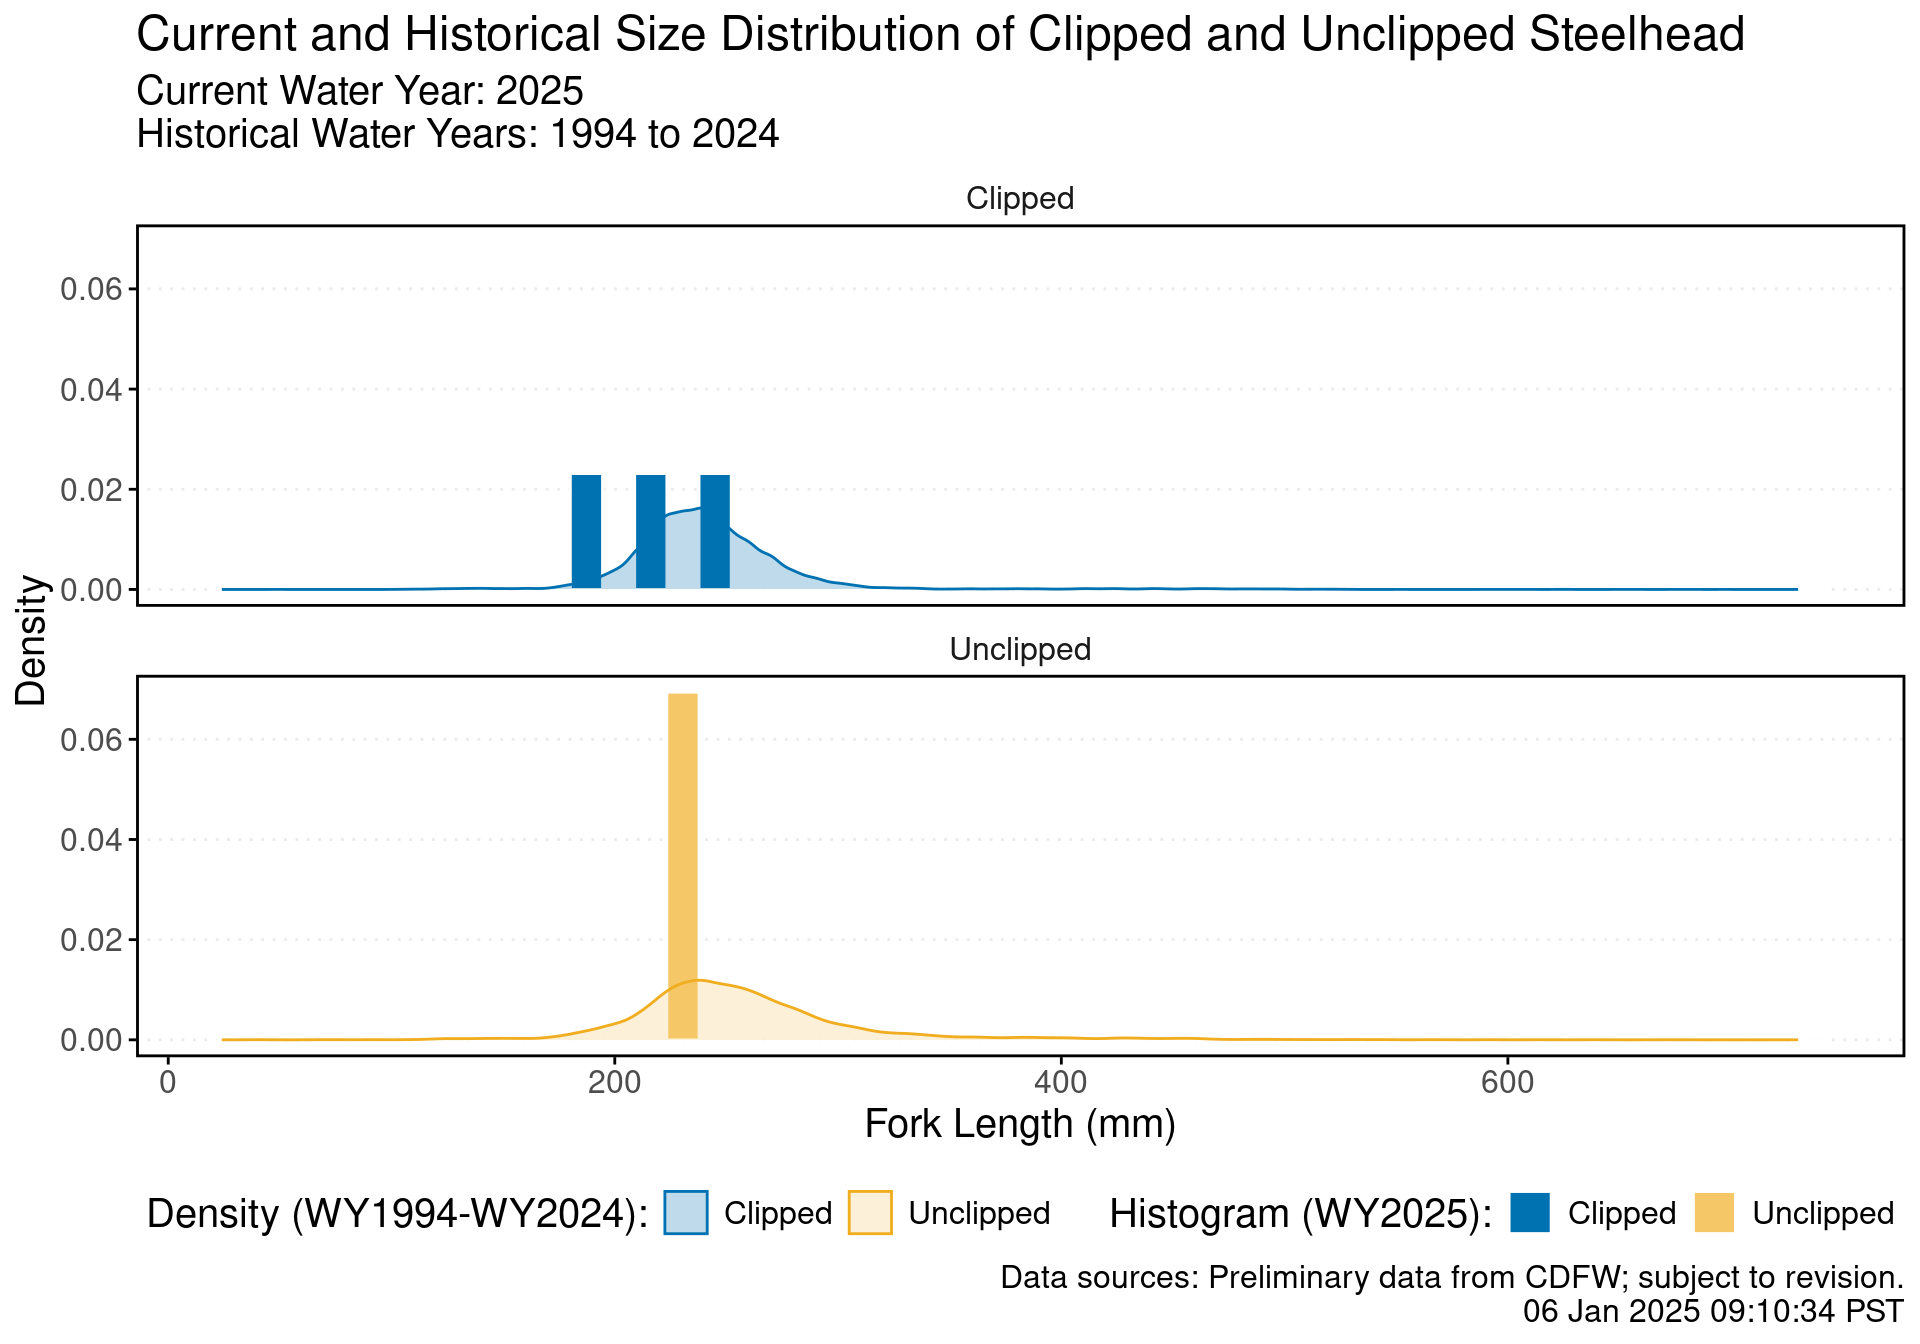
Size (Fork Length) Distribution of Steelhead Loss, Combined
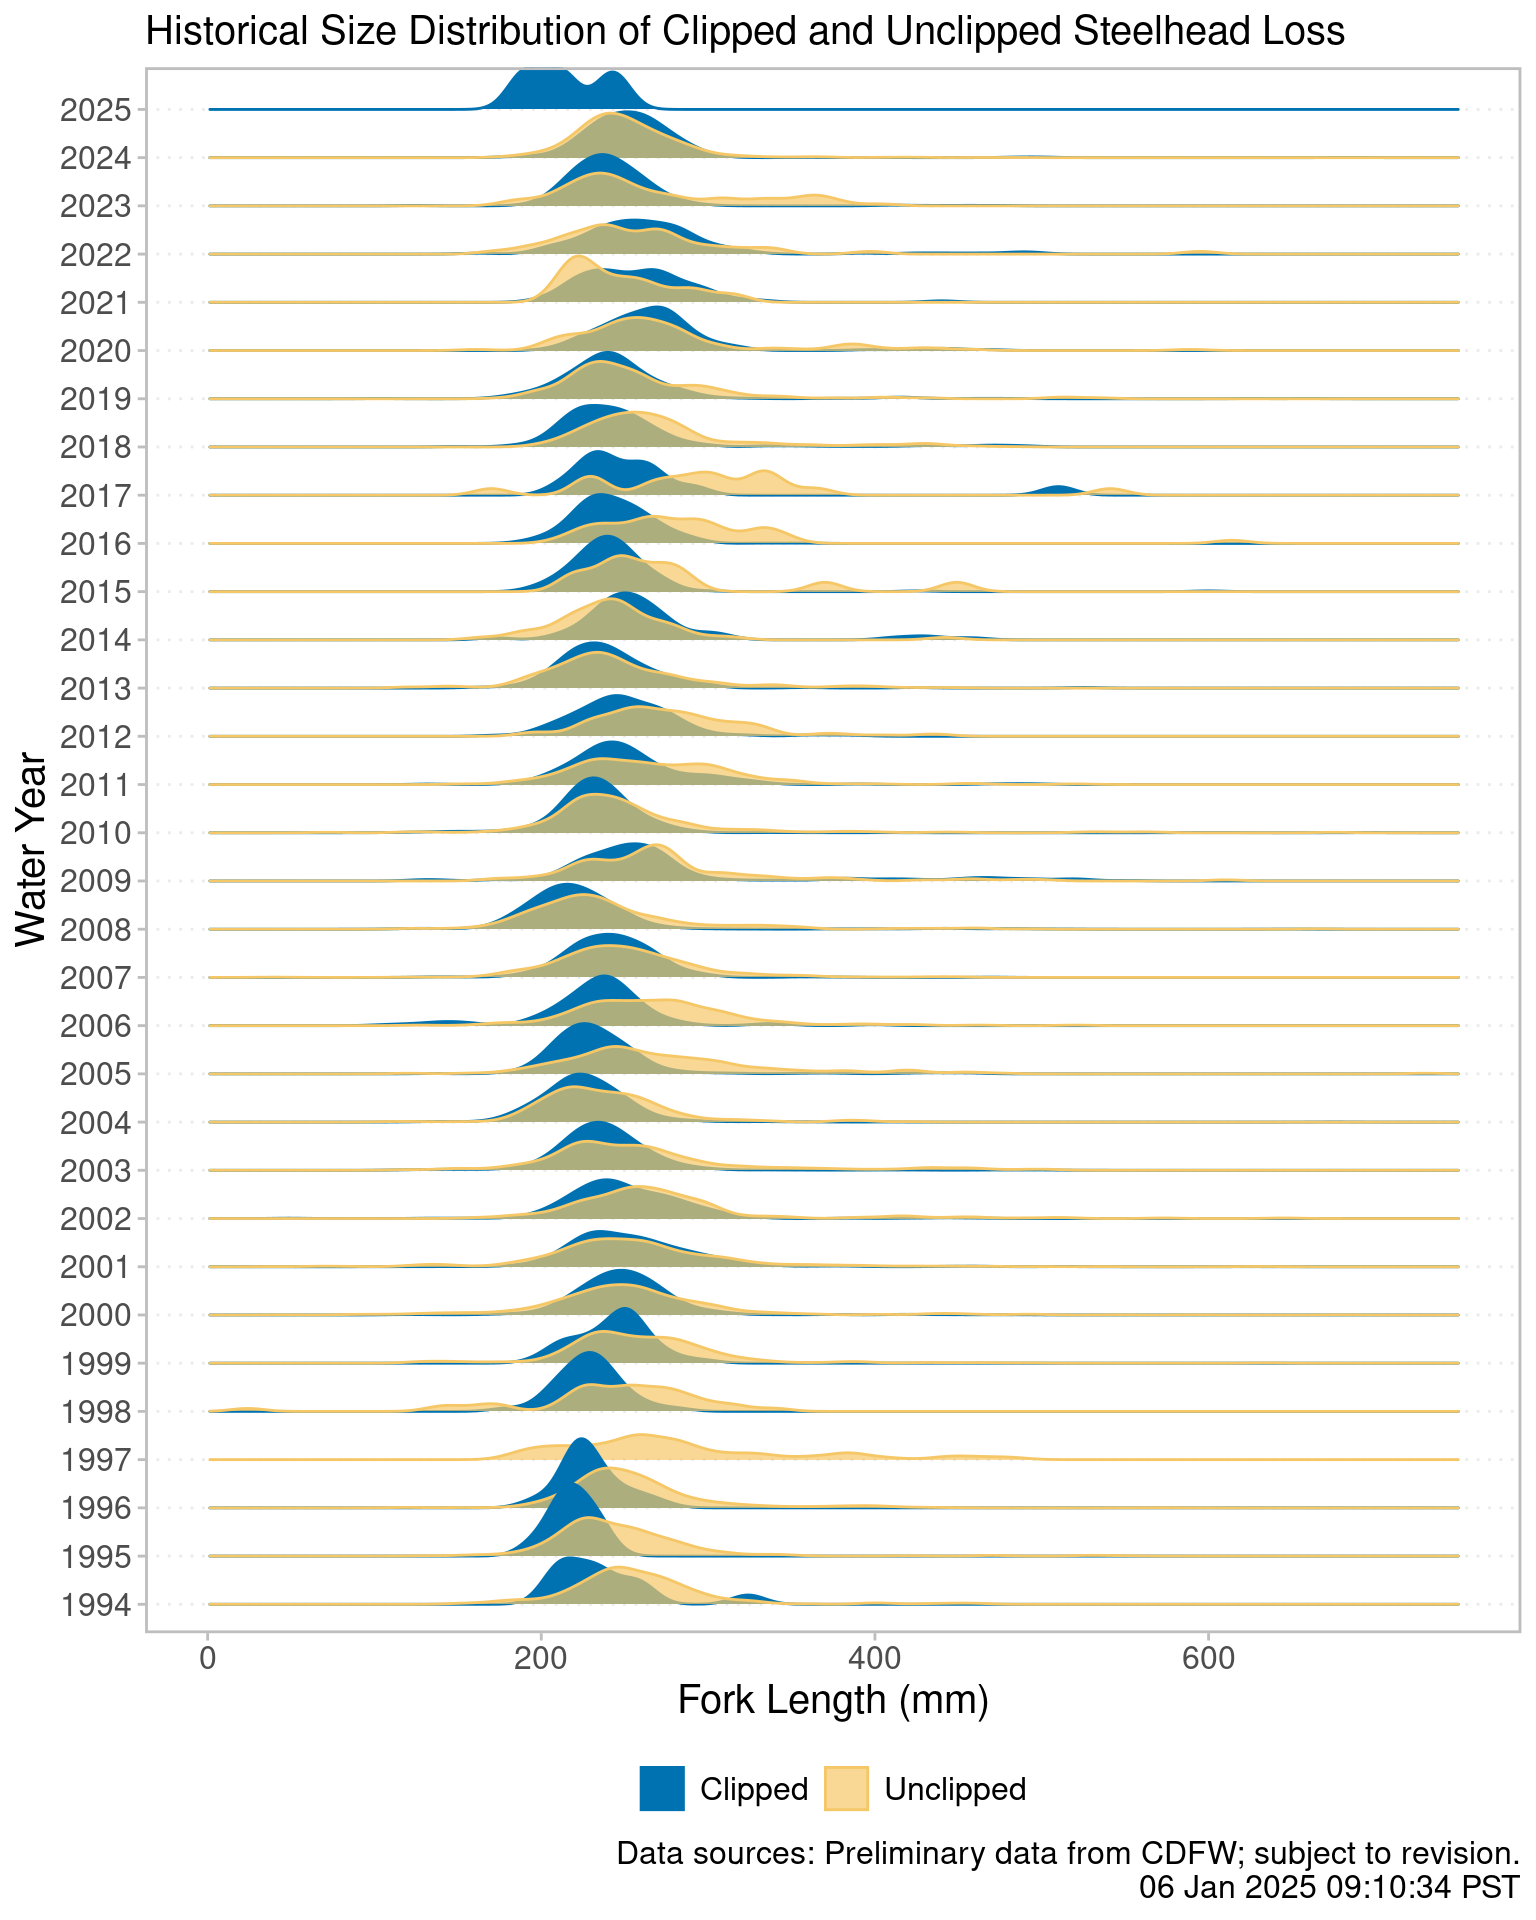
WY Size (Fork Length) Distribution of Steelhead Loss
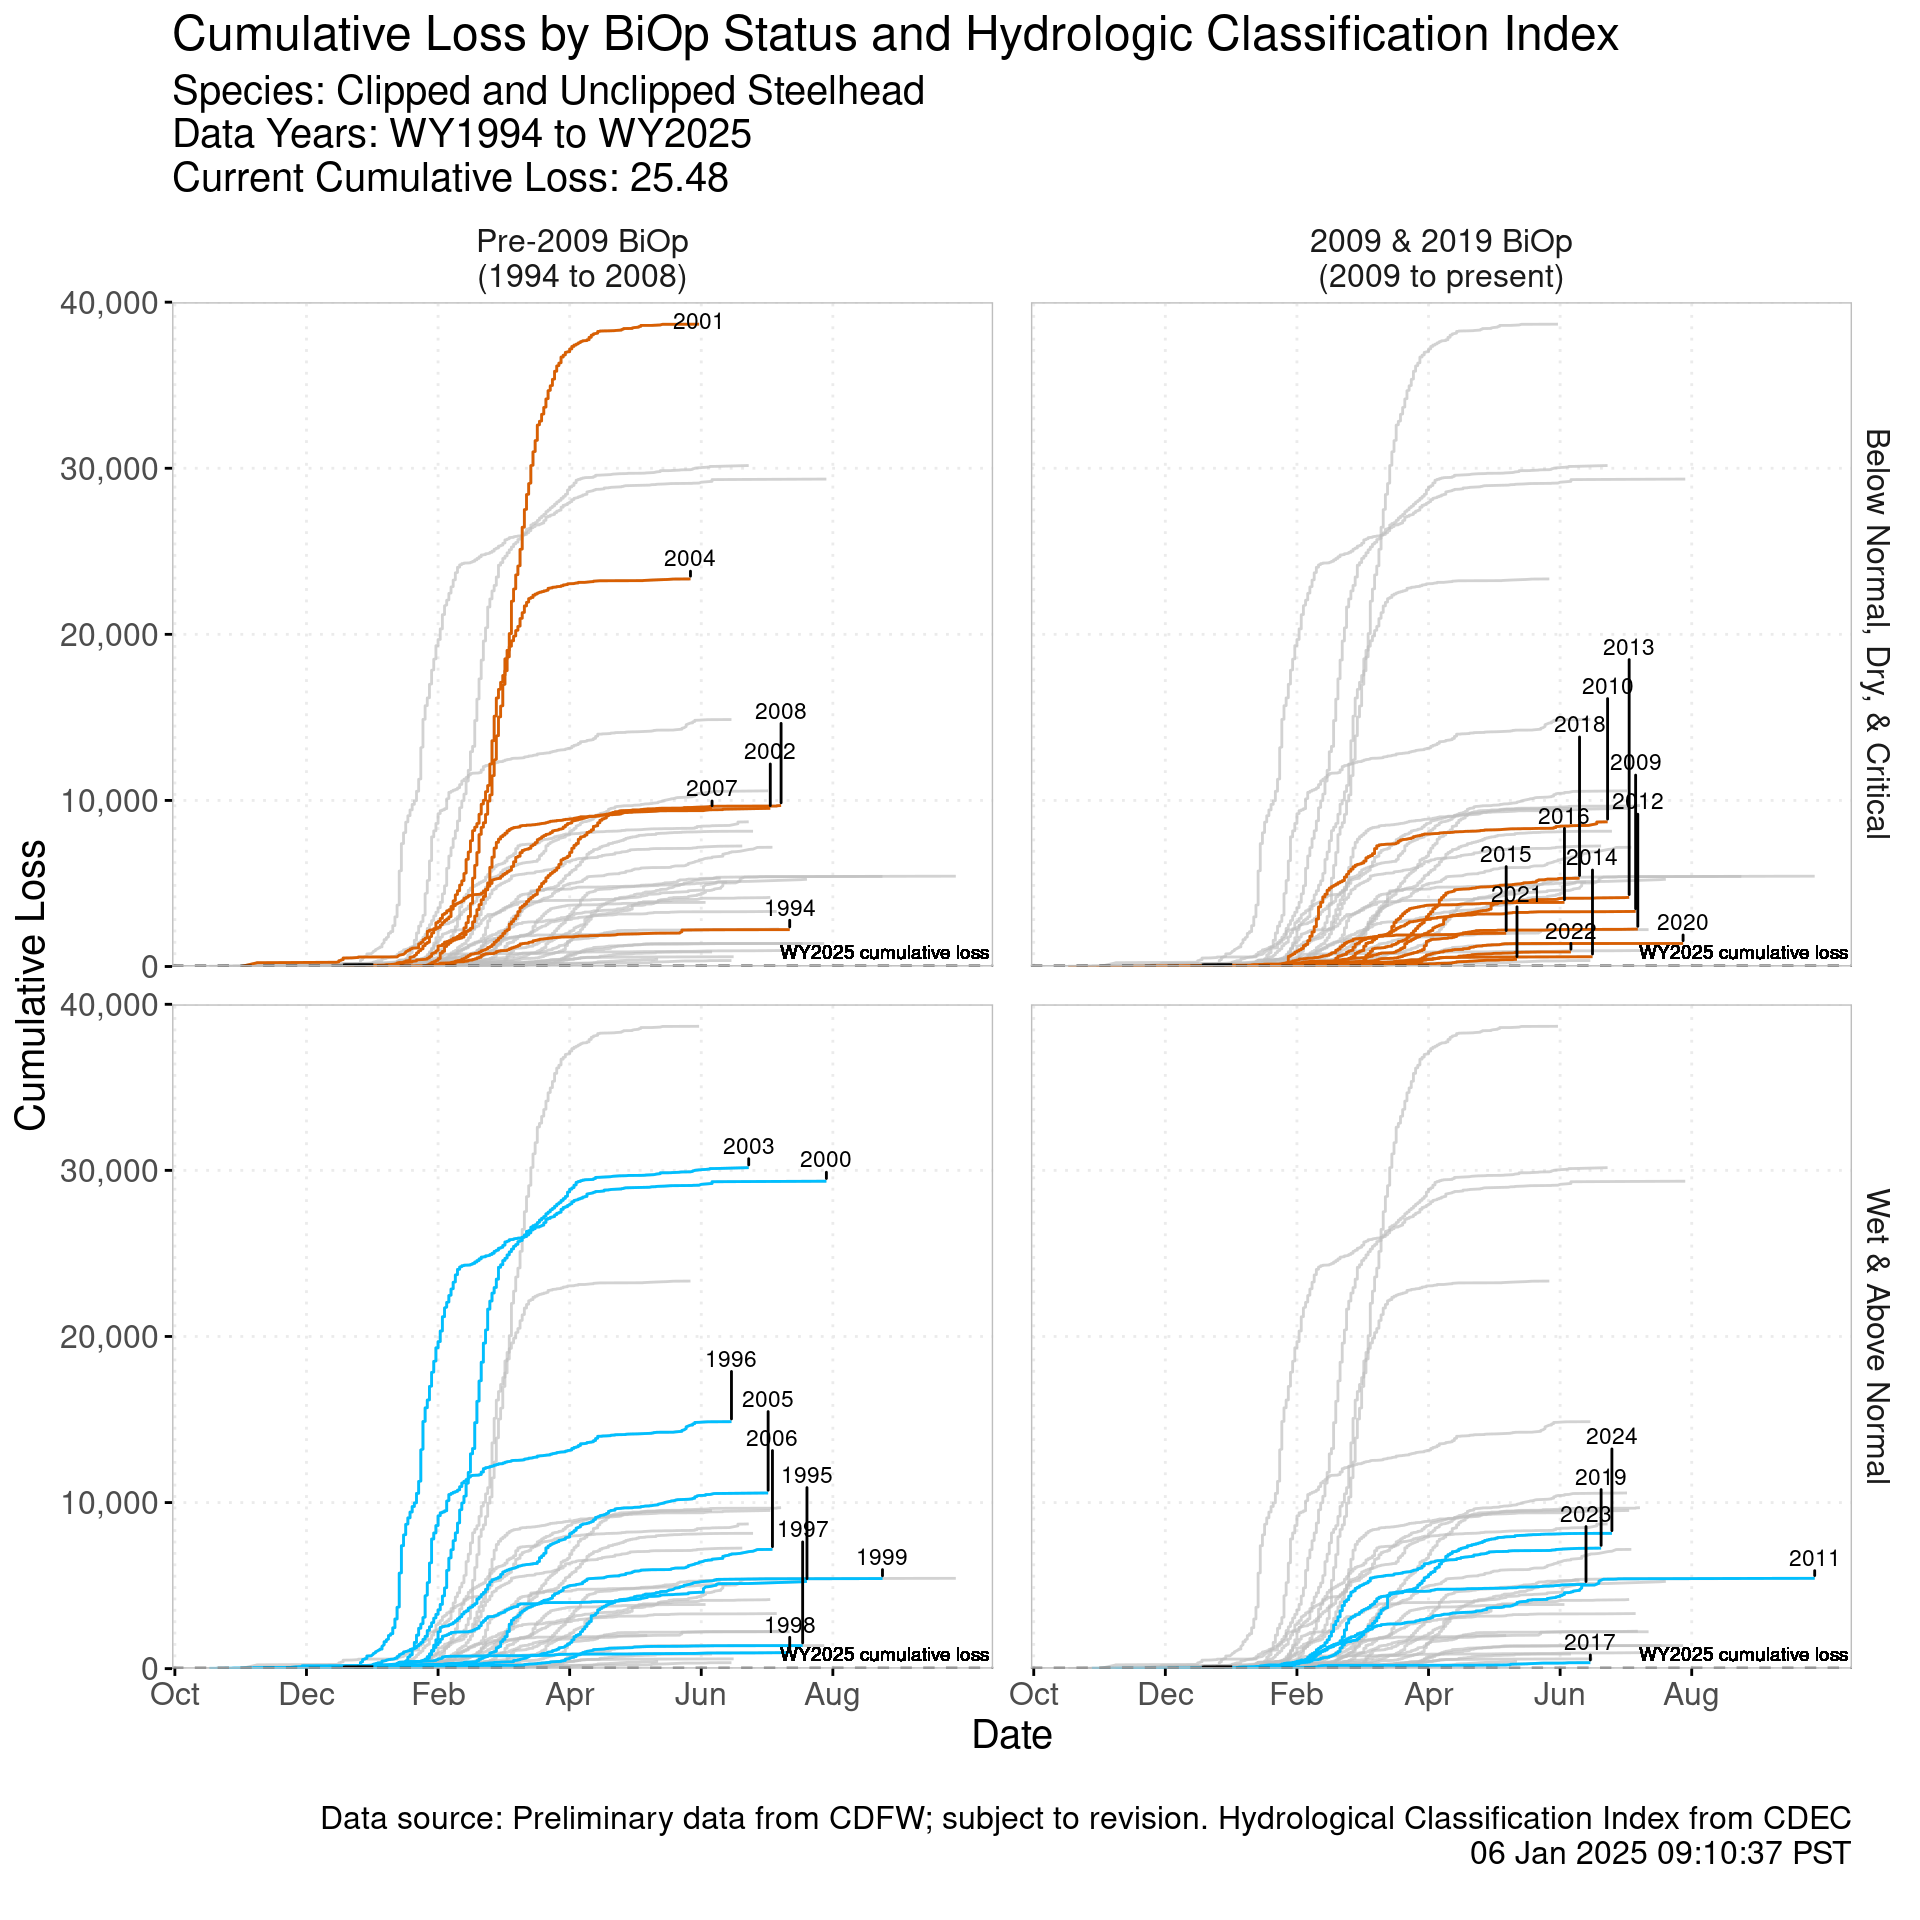
Cumulative Loss by BiOp Status and Hydrologic Classification Index
Loss Single Year Thresholds
Included from Salmonids, Steelhead, and Current Conditions for the Delta Actions Team (DAT), Workgroups & Teams.
Minimization of Loss
| Water Year (WY) | Brood Year (BY) | Total Hatchery Steelhead Releases (BY) | Loss of clipped steelhead at the facilities (WY) | % Loss of Total Hatchery Releases |
|---|---|---|---|---|
| 2026 | 2025 | 1231255 | 1445.82 | 0.117 |
| 2025 | 2024 | 1121944 | 2532.14 | 0.226 |
| 2024 | 2023 | 1634566 | 2850.32 | 0.174 |
| 2023 | 2022 | 1649795 | 3655.74 | 0.222 |
| 2022 | 2021 | 1921199 | 639.79 | 0.033 |
| 2021 | 2020 | 1861923 | 341.69 | 0.018 |
| 2020 | 2019 | 1814005 | 659.44 | 0.036 |
| 2019 | 2018 | 1733308 | 5777.70 | 0.333 |
| 2018 | 2017 | 1175220 | 2462.90 | 0.210 |
| 2017 | 2016 | 1123732 | 164.29 | 0.015 |
| 2016 | 2015 | 1157538 | 3566.87 | 0.308 |
| 2015 | 2014 | 1989241 | 1841.19 | 0.093 |
| 2014 | 2013 | 1869840 | 327.83 | 0.018 |
| 2013 | 2012 | 1582850 | 1901.95 | 0.120 |
| 2012 | 2011 | 1782273 | 1141.16 | 0.064 |
| 2011 | 2010 | 1237276 | 2823.07 | 0.228 |
| 2010 | 2009 | 1477137 | 6548.28 | 0.443 |
| 2009 | 2008 | 1418351 | 2439.11 | 0.172 |
| 2008 | 2007 | 2085025 | 6558.86 | 0.315 |
| 2007 | 2006 | 1927957 | 4173.84 | 0.216 |
| 2006 | 2005 | 1644433 | 2758.54 | 0.168 |
| 2005 | 2004 | 1976013 | 6661.86 | 0.337 |
| 2004 | 2003 | 1413446 | 18643.98 | 1.319 |
| 2003 | 2002 | 1720653 | 24077.48 | 1.399 |
| 2002 | 2001 | 1093881 | 5957.45 | 0.545 |
| 2001 | 2000 | 1152854 | 24779.83 | 2.149 |
| 2000 | 1999 | 863763 | 18795.42 | 2.176 |
| 1999 | 1998 | 969822 | 555.64 | 0.057 |
| 1998 | 1997 | 954247 | 496.44 | 0.052 |
| 1997 | 1996 | 117434 | 4.33 | 0.004 |
| 1996 | 1995 | 930462 | 330.74 | 0.036 |
| 1995 | 1994 | 1276130 | 146.72 | 0.011 |
| 1994 | 1993 | 1327884 | 125.25 | 0.009 |
| 1993 | 1992 | 1416943 | 1576.95 | 0.111 |
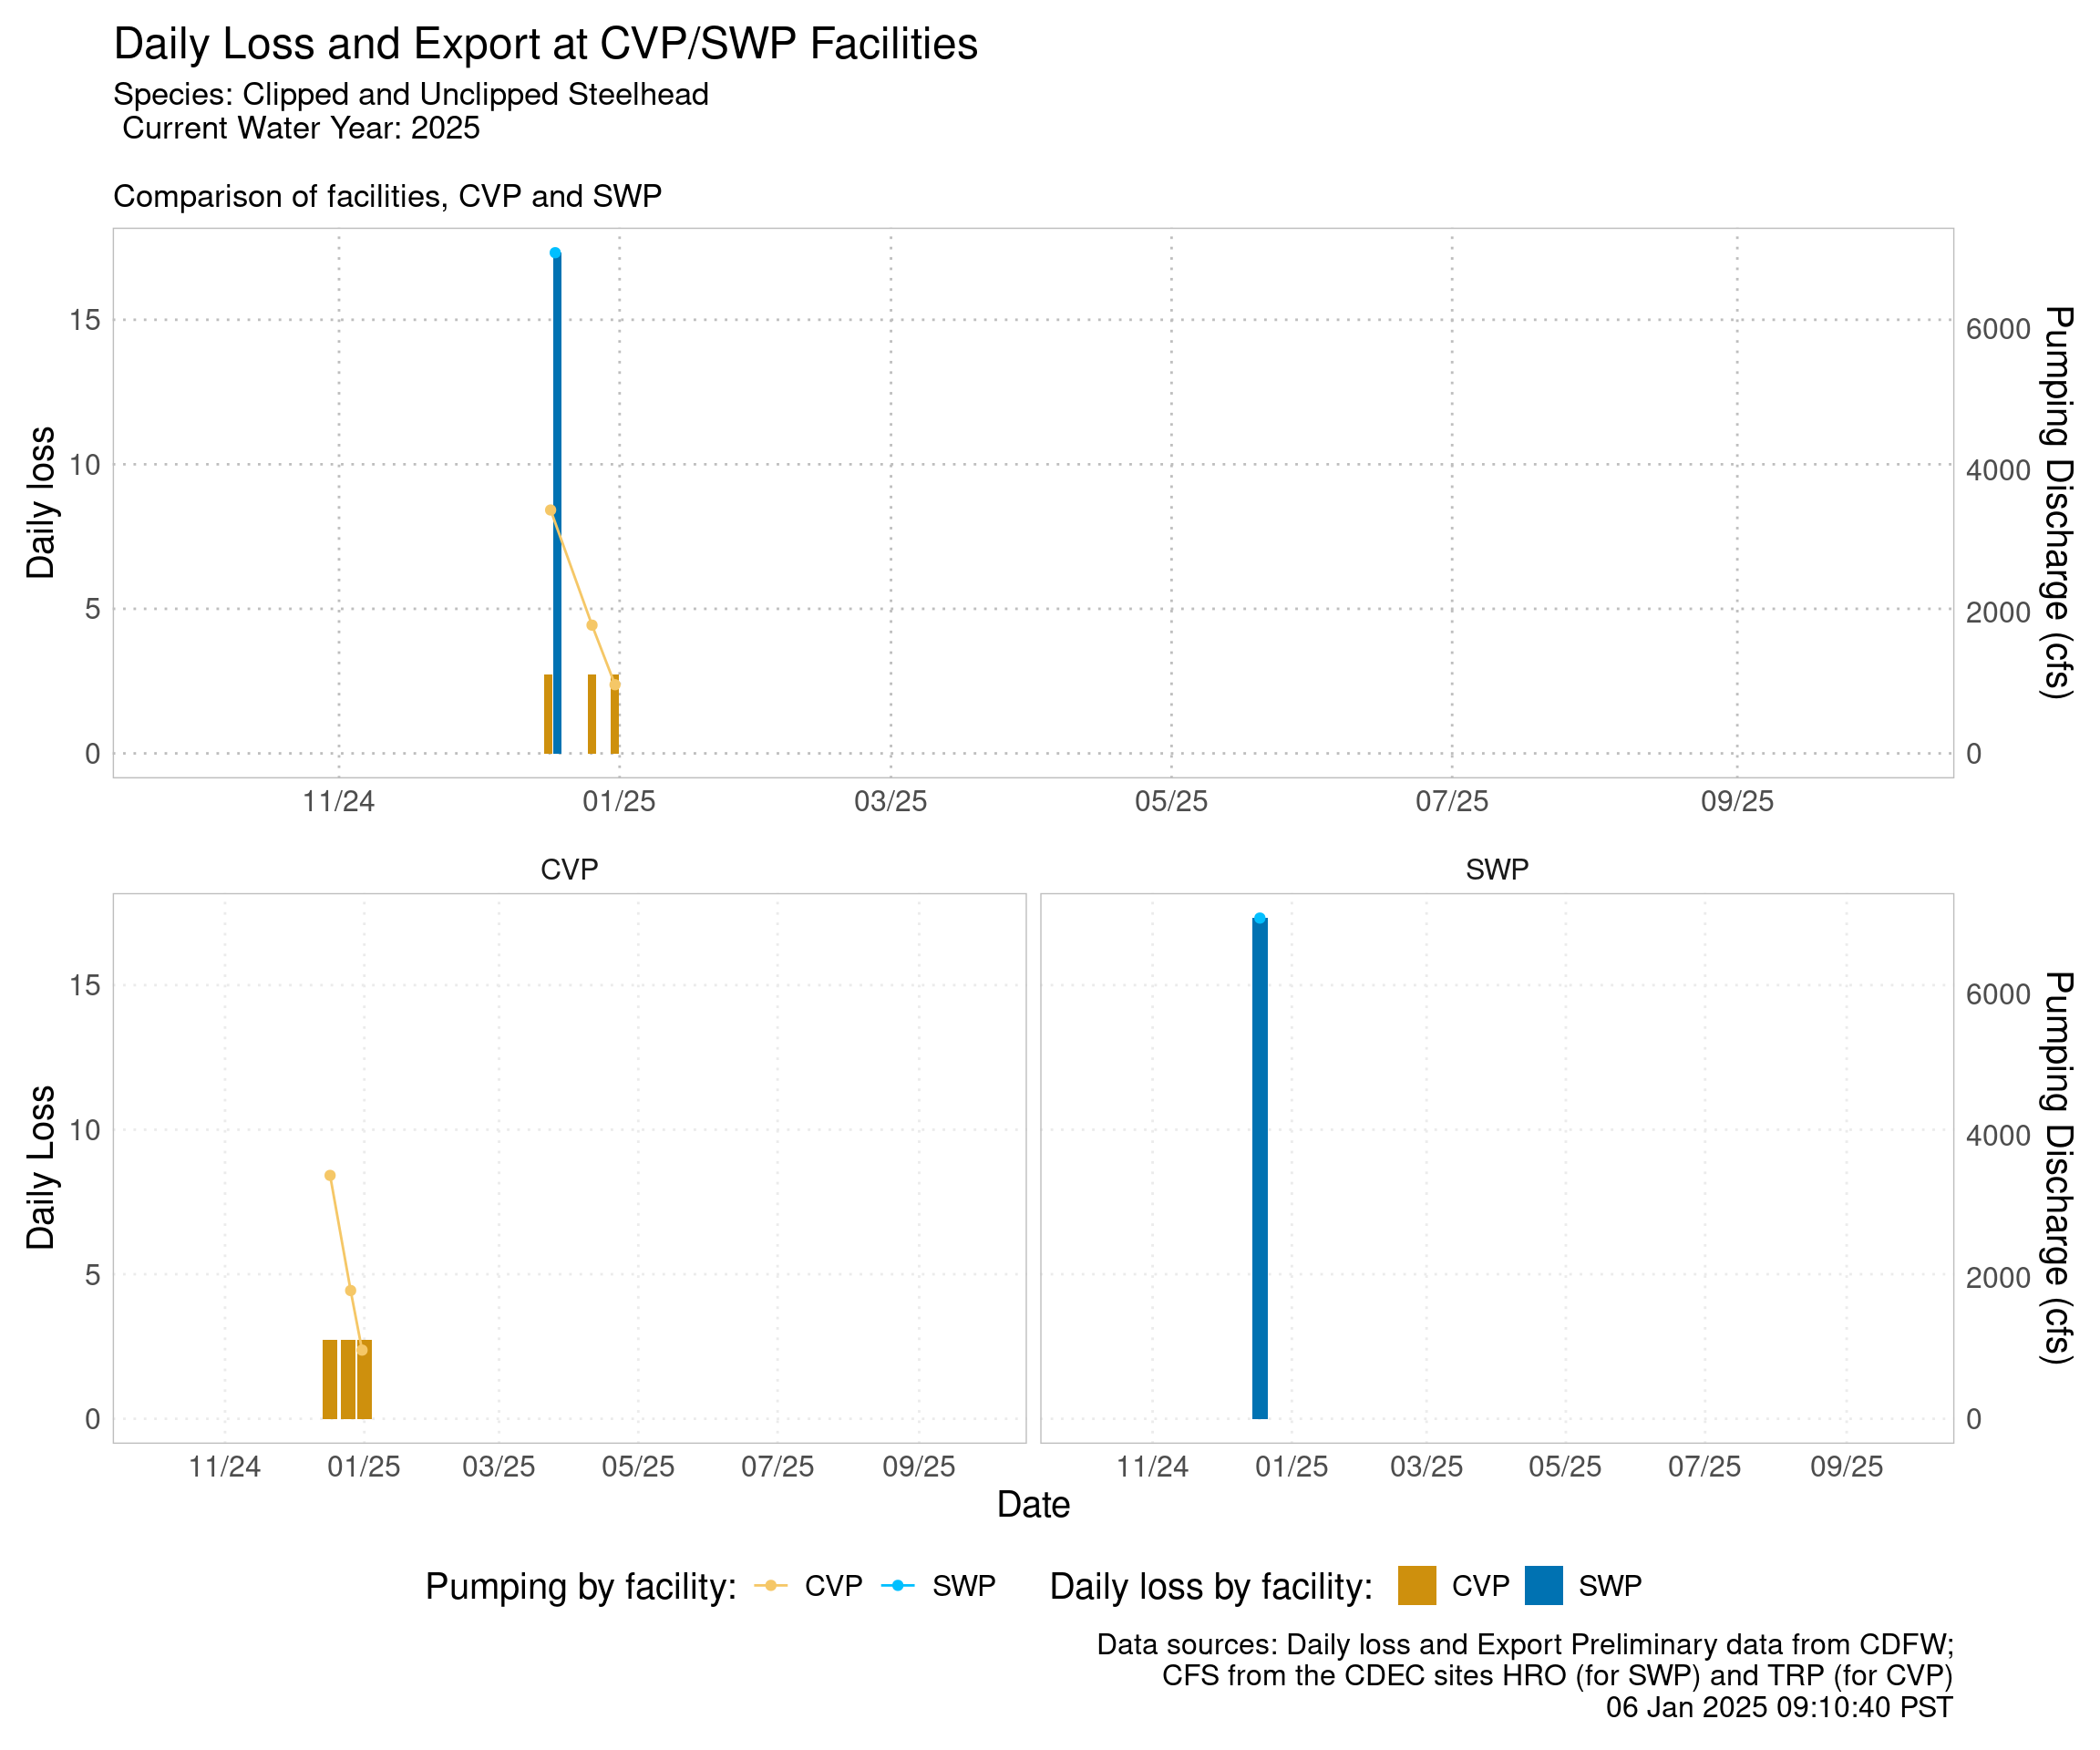
Daily Loss and Export with OMR
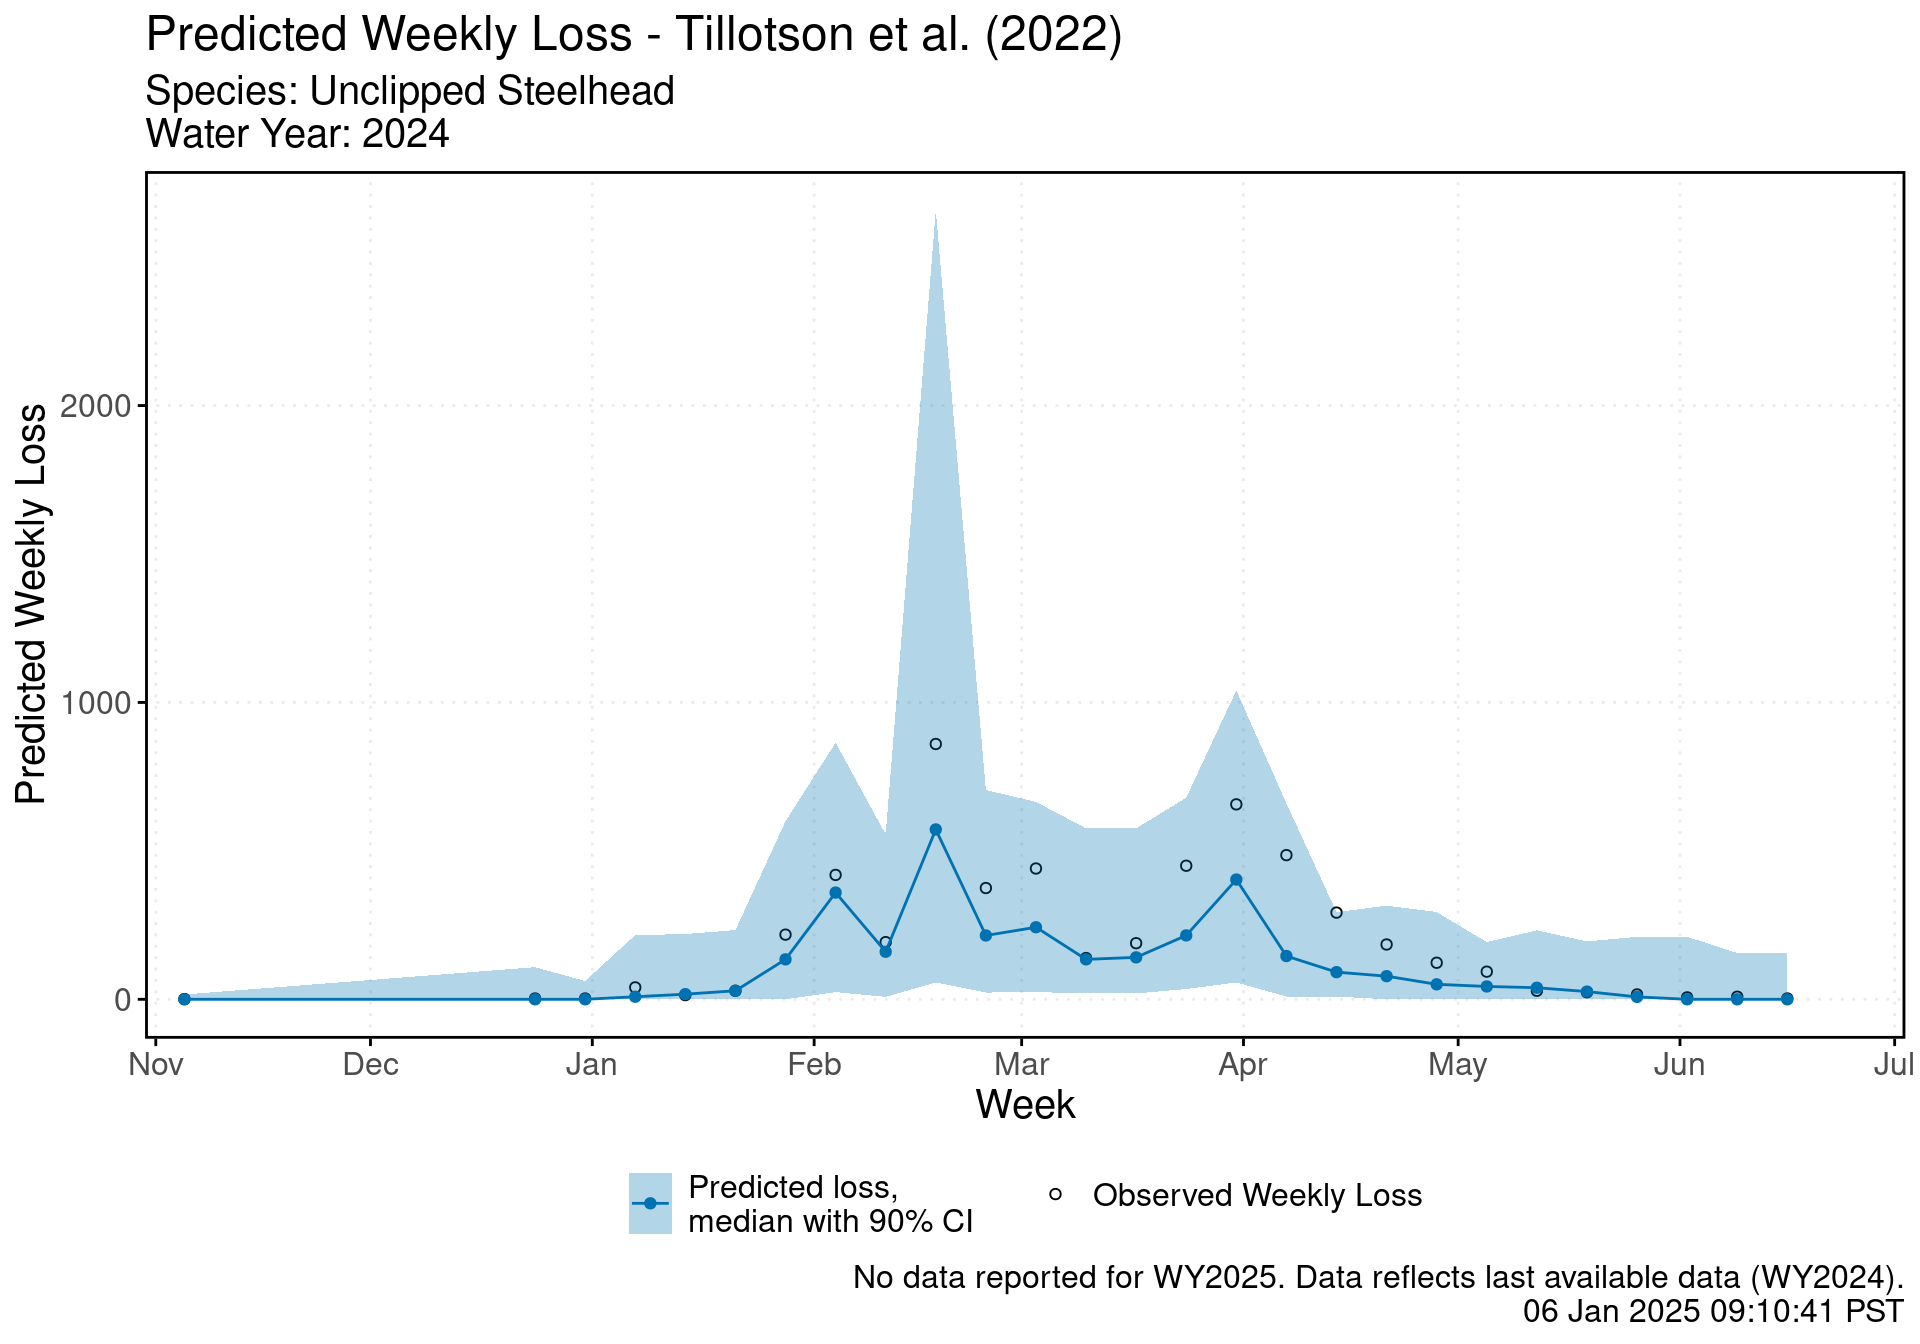
Predicted Weekly Loss
| WY week | Date | Median weekly predicted loss [lower CI, upper CI] | Observed Data | |||||
|---|---|---|---|---|---|---|---|---|
| Observed loss | OMR USGS tidally filtered (CFS) | Export, SWP & CVP (CFS) | Avg flow at Sacramento (CFS) | Avg flow at San Joaquin (CFS) | Avg water temperature at Mallard Island (°C) | |||
| 25 | 2026-03-18 | 26.0 [0.0, 383.7] | 0.0 | -5350.0 | 5391.3 | 20744.7 | 4236.6 | 17.3 |
| 24 | 2026-03-11 | 42.3 [0.0, 464.6] | 7.1 | -5661.4 | 6888.2 | 25672.7 | 4826.0 | 15.4 |
| 23 | 2026-03-04 | 77.2 [0.0, 483.0] | 21.7 | -5994.3 | 7243.9 | 42033.9 | 5716.3 | 14.0 |
| 22 | 2026-02-25 | 118.9 [0.0, 483.0] | 48.7 | -6070.0 | 7987.7 | 52555.7 | 7268.9 | 12.4 |
| 21 | 2026-02-18 | 120.2 [0.0, 494.5] | 46.2 | -5805.7 | 7702.2 | 43778.6 | 7631.4 | 11.2 |
| 20 | 2026-02-11 | 27.9 [0.0, 406.9] | 0.0 | -5071.4 | 5272.2 | 31045.7 | 2936.8 | 12.3 |
| 19 | 2026-02-04 | 26.0 [0.0, 285.1] | 2.7 | -3932.9 | 4147.5 | 29624.8 | 2320.6 | 11.7 |
| 18 | 2026-01-28 | 21.7 [0.0, 244.0] | 37.4 | -3583.3 | 3575.2 | 25740.0 | 2041.0 | 10.9 |
| 17 | 2026-01-21 | 20.0 [0.0, 358.0] | 2.7 | -5664.3 | 6076.6 | 32144.6 | 2339.5 | 10.4 |
| 16 | 2026-01-14 | 17.3 [0.0, 147.5] | 0.0 | -4711.4 | 5506.9 | 47209.2 | 2576.4 | 10.4 |
| 15 | 2026-01-07 | 42.3 [0.0, 383.7] | 38.5 | -5178.6 | 6781.0 | 70255.2 | 3328.3 | 10.8 |
| 14 | 2025-12-31 | 17.3 [0.0, 154.4] | 2.7 | -5344.3 | 5673.3 | 63590.4 | 2732.9 | 11.0 |
| 13 | 2025-12-24 | 0.0 [0.0, 154.4] | 2.7 | -5665.7 | 6727.9 | 63788.2 | 3999.7 | 11.7 |
| 12 | 2025-12-17 | 0.0 [0.0, 76.4] | 0.0 | -5751.4 | 6841.4 | 22016.3 | 3421.3 | 10.4 |
| 11 | 2025-12-10 | 0.0 [0.0, 8.2] | 0.0 | -3388.6 | 2922.0 | 10079.5 | 1161.4 | 10.1 |
| 10 | 2025-12-03 | 0.0 [0.0, 17.3] | 0.0 | -3607.3 | 3456.7 | 10460.5 | 2037.8 | 11.7 |
| 9 | 2025-11-26 | 0.0 [0.0, 17.3] | 0.0 | -6551.4 | 7064.3 | 12044.9 | 1292.4 | 13.4 |
| 8 | 2025-11-19 | 0.0 [0.0, 78.6] | 0.0 | -8214.3 | 9724.4 | 16832.3 | 1911.5 | 15.4 |
| 7 | 2025-11-12 | 0.0 [0.0, 17.3] | 0.0 | -7208.6 | 4097.9 | 12650.7 | 1325.2 | 16.9 |
| 6 | 2025-11-05 | 0.0 [0.0, 2.7] | 0.0 | -5752.9 | 5641.6 | 10914.5 | 1147.7 | 17.6 |
| 5 | 2025-10-29 | 0.0 [0.0, 0.1] | 0.0 | -5190.0 | 4730.4 | 11089.9 | 1682.7 | 17.7 |
| 4 | 2025-10-22 | 0.0 [0.0, 0.0] | 0.0 | -4530.0 | 4474.4 | 11554.7 | 2092.1 | 18.1 |
| 3 | 2025-10-15 | 0.0 [0.0, 8.2] | 0.0 | -4995.7 | 4695.4 | 12199.6 | 2095.0 | 18.5 |
| 2 | 2025-10-08 | 0.0 [0.0, 17.3] | 0.0 | -5984.3 | 5233.0 | 15629.0 | 1260.7 | 19.8 |
| 1 | 2025-10-01 | 0.0 [0.0, 17.3] | 0.0 | -9802.9 | 9468.0 | 18779.4 | 1021.0 | 20.7 |
Adults in Ocean
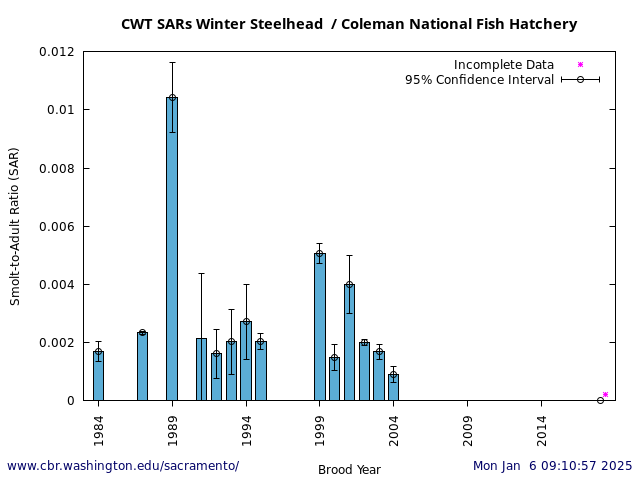
CWT Smolt-to-Adult — annual data
Adults in River
No data sets or products to offer at this time.