
2026-01-09: Jersey Point Flow (JPF) calculated by DWR added to Operational Indices Daily Data table.
2025-12-20: Life stage applied to catch and salvage based on fork length and reported in the two week and water year tables.
Daily Conditions for Last 2 Weeks
| Date | QWEST (CFS) [DWR] | QWEST 7-day (CFS) [DWR] | JPF (CFS) [DWR] | X2 Position (KM) [DWR] | OMR Index (CFS) [SacPAS] | OMR Index 5-day (CFS) [SacPAS] | OMR Index 14-day (CFS) [SacPAS] | USGS Tidally Filtered OMR (CFS) [USGS] | USGS Tidally Filtered OMR 5-day mean (CFS) [USGS] | USGS Tidally Filtered OMR 14-day mean (CFS) [USGS] | NDOI (CFS) [DWR] | NDOI 3-day (CFS) [DWR] | E/I Ratio 3 day (%) [DWR] | Sum Pumping Discharge HRO+TRP (CFS) [CDEC:HRO+TRP] | Pumping Discharge Harvey O Banks Pumping Plant (CFS) [CDEC:HRO] | Pumping Discharge SJR Tracy Pumping Plant (CFS) [CDEC:TRP] | Pumping Discharge Barker Slough (CFS) [CDEC:BKS] | Pumping Discharge Barker Slough 7-day (CFS) [CDEC:BKS] |
|---|---|---|---|---|---|---|---|---|---|---|---|---|---|---|---|---|---|---|
| Date | QWEST (CFS) [DWR] | QWEST 7-day (CFS) [DWR] | JPF (CFS) [DWR] | X2 Position (KM) [DWR] | OMR Index (CFS) [SacPAS] | OMR Index 5-day (CFS) [SacPAS] | OMR Index 14-day (CFS) [SacPAS] | USGS Tidally Filtered OMR (CFS) [USGS] | USGS Tidally Filtered OMR 5-day mean (CFS) [USGS] | USGS Tidally Filtered OMR 14-day mean (CFS) [USGS] | NDOI (CFS) [DWR] | NDOI 3-day (CFS) [DWR] | E/I Ratio 3 day (%) [DWR] | Sum Pumping Discharge HRO+TRP (CFS) [CDEC:HRO+TRP] | Pumping Discharge Harvey O Banks Pumping Plant (CFS) [CDEC:HRO] | Pumping Discharge SJR Tracy Pumping Plant (CFS) [CDEC:TRP] | Pumping Discharge Barker Slough (CFS) [CDEC:BKS] | Pumping Discharge Barker Slough 7-day (CFS) [CDEC:BKS] |
| 2026-04-17 | 7762 | 8829 | 7883 | 67 | -1269 | -1391 | -2610 | -2800 | -2856 | -3726 | 35829 | 41514 | 5.3 | 2218 | 847.00 | 1371.00 | 48 | 33 |
| 2026-04-18 | 6879 | 9454 | 6991 | -1286 | -1396 | -2472 | -3030 | -2948 | -3615 | 32533 | 36735 | 5.1 | 1888 | 515.00 | 1373.00 | 49 | 40 | |
| 2026-04-19 | 5947 | 9478 | 6088 | -1180 | -1342 | -2333 | -2900 | -2954 | -3497 | 29405 | 32589 | 5.3 | 1834 | 527.00 | 1307.00 | 50 | 44 | |
| 2026-04-20 | 5137 | 8635 | 5260 | 68 | -1420 | -1289 | -2214 | -2580 | -2830 | -3377 | 26843 | 29594 | 6.0 | 2435 | 1160.00 | 1275.00 | 60 | 47 |
| 2026-04-21 | 5916 | 7641 | 6038 | 68 | -1424 | -1316 | -2098 | -1732 | -2608 | -3214 | 27342 | 27863 | 7.0 | 2039 | 853.00 | 1186.00 | 63 | 51 |
| 2026-04-22 | 10591 | 7436 | 10717 | 68 | -1432 | -1348 | -1976 | -1546 | -2358 | -3058 | 35797 | 29994 | 7.9 | 2497 | 1075.00 | 1422.00 | 62 | 54 |
| 2026-04-23 | 11786 | 7717 | 11904 | 65 | -1573 | -1406 | -1837 | -2038 | -2159 | -2933 | 39456 | 34198 | 8.1 | 3082 | 1655.00 | 1427.00 | 55 | 55 |
| 2026-04-24 | 11847 | 8300 | 11960 | 63 | -1536 | -1477 | -1694 | -2434 | -2066 | -2797 | 42162 | 39138 | 7.8 | 2905 | 1295.00 | 1610.00 | 39 | 54 |
| 2026-04-25 | 12006 | 9033 | 12113 | -1428 | -1479 | -1546 | -2424 | -2035 | -2628 | 43509 | 41709 | 7.5 | 2892 | 1295.00 | 1597.00 | 35 | 52 | |
| 2026-04-26 | 9926 | 9601 | 10034 | -1610 | -1516 | -1419 | -2369 | -2162 | -2524 | 38726 | 41466 | 7.3 | 2730 | 1075.00 | 1655.00 | 37 | 50 | |
| 2026-04-27 | 5495 | 9652 | 5596 | 62 | -1460 | -1521 | -1434 | -2547 | -2362 | -2522 | 29497 | 37244 | 7.4 | 2705 | 1185.00 | 1520.00 | 36 | 47 |
| 2026-04-28 | 4980 | 9519 | 5044 | 62 | -1620 | -1531 | -1452 | -2760 | -2507 | -2514 | 27036 | 31753 | 8.0 | 2861 | 1185.00 | 1676.00 | 43 | 44 |
| 2026-04-29 | 4540 | 8654 | 4600 | 62 | -1542 | -1532 | -1445 | -2840 | -2588 | -2489 | 24800 | 27111 | 8.4 | 2945 | 1289.00 | 1656.00 | 47 | 42 |
| 2026-04-30 | 4088 | 7555 | 4155 | -1504 | -1547 | -1449 | 22186 | 24674 | 9.0 | 2738 | 1199.00 | 1539.00 | 47 | 41 |
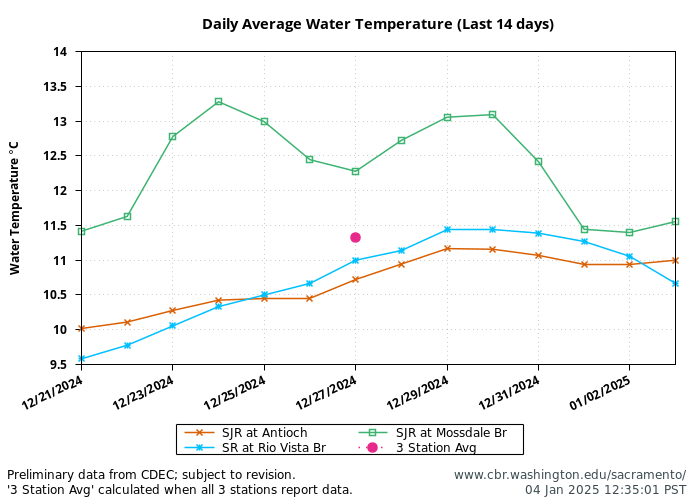
| Date | River Discharge Flow 3-day Freeport (CFS) [CDEC:FPT] | River Discharge Flow SJR nr Vernalis (CFS) [CDEC:VNS] | Rio Vista Flow (CFS) [DWR] | Water Temperature 3-day Jersey Point (C) [CDEC:SJW] | Water Temperature 3-day SR at Rio Vista Br (C) [CDEC:RVB] | Water Temperature Clifton Court (C) [CDEC:CLC] | Water Temperature SJR at Antioch (C) [CDEC:ANH] | Turbidity 3-day Freeport (FNU) [CDEC:FPT] | Water Turbidity 1-day Old River at Bacon Island (USGS) (FNU) [CDEC:OBI] | Water Turbidity 1-day Old River at Franks Tract (FNU) [CDEC:OSJ] | Water Turbidity 1-day SJR Holland Cut (FNU) [CDEC:HOL] |
|---|---|---|---|---|---|---|---|---|---|---|---|
| Date | River Discharge Flow 3-day Freeport (CFS) [CDEC:FPT] | River Discharge Flow SJR nr Vernalis (CFS) [CDEC:VNS] | Rio Vista Flow (CFS) [DWR] | Water Temperature 3-day Jersey Point (C) [CDEC:SJW] | Water Temperature 3-day SR at Rio Vista Br (C) [CDEC:RVB] | Water Temperature Clifton Court (C) [CDEC:CLC] | Water Temperature SJR at Antioch (C) [CDEC:ANH] | Turbidity 3-day Freeport (FNU) [CDEC:FPT] | Water Turbidity 1-day Old River at Bacon Island (USGS) (FNU) [CDEC:OBI] | Water Turbidity 1-day Old River at Franks Tract (FNU) [CDEC:OSJ] | Water Turbidity 1-day SJR Holland Cut (FNU) [CDEC:HOL] |
| 2026-04-17 | 32375.67 | 2075.20 | 28200 | 17.65 | 15.61 | 17.60 | 17.22 | 15.02 | 3.05 | 6.24 | 9.30 |
| 2026-04-18 | 29875.33 | 2149.13 | 25804 | 17.39 | 15.48 | 18.00 | 17.22 | 13.95 | 3.44 | 5.34 | 3.76 |
| 2026-04-19 | 28076.00 | 2484.16 | 23641 | 17.36 | 15.50 | 18.60 | 17.33 | 12.95 | 3.21 | 4.97 | 2.78 |
| 2026-04-20 | 26707.33 | 2629.17 | 21897 | 17.48 | 15.67 | 18.70 | 17.22 | 11.56 | 2.78 | 4.43 | 2.28 |
| 2026-04-21 | 26589.00 | 2881.52 | 21476 | 17.53 | 15.81 | 18.60 | 17.11 | 10.78 | 2.81 | 4.20 | 1.98 |
| 2026-04-22 | 27666.67 | 3165.44 | 24810 | 17.46 | 15.83 | 18.30 | 17.11 | 11.13 | 2.49 | 4.17 | 1.98 |
| 2026-04-23 | 29766.33 | 3228.16 | 27252 | 17.48 | 15.85 | 18.60 | 17.39 | 12.53 | 2.09 | 4.77 | 1.81 |
| 2026-04-24 | 31785.33 | 3245.84 | 29879 | 17.59 | 15.91 | 18.80 | 17.61 | 14.44 | 1.49 | 11.84 | 1.27 |
| 2026-04-25 | 32348.67 | 2988.08 | 31068 | 17.64 | 16.04 | 18.20 | 17.39 | 17.52 | 1.51 | 9.18 | 1.41 |
| 2026-04-26 | 31310.33 | 3035.48 | 28510 | 17.53 | 16.13 | 17.60 | 17.17 | 18.28 | 1.53 | 7.17 | 1.35 |
| 2026-04-27 | 28988.67 | 3093.68 | 24159 | 17.33 | 16.17 | 17.80 | 17.11 | 18.20 | 1.57 | 10.60 | 1.37 |
| 2026-04-28 | 26780.33 | 2873.84 | 22235 | 17.31 | 16.30 | 18.10 | 17.39 | 15.68 | 1.43 | 6.91 | 1.32 |
| 2026-04-29 | 24627.67 | 2922.40 | 20447 | 17.48 | 16.56 | 18.50 | 17.67 | 15.07 | 1.37 | 10.37 | 1.26 |
| 2026-04-30 | 22405.33 | 2953.29 | 18285 | 17.73 | 16.94 | 19.20 | 17.83 | 14.45 | 1.47 | 4.19 | 1.50 |
Delta Smelt Releases
| Date | Location | ~Days post hatch | Release Method | Adipose Fin Clipped | VIE Tagged | VIE Color and Position | Total Released | Description |
|---|---|---|---|---|---|---|---|---|
| 2025-12-16 | Sacramento River at Rio Vista | >200 | Hard Release (fish truck) | 0% | 0% | 24606 | On 2025-12-16, the USFWS will truck approximately ~24606 brood year 2025 Delta Smelt from the FC&CL to Sacramento River at Rio Vista for release into the Delta. This release will include 0% Adipose fin clipped individuals and 0% Visible Implant Elastomer tagged individuals. | |
| 2025-12-03 | Belden’s Landing boat ramp in Suisun Marsh | >200 | Hard Release (fish truck) | 0% | 0% | 35298 | On 2025-12-03, the USFWS will truck approximately ~35298 brood year 2025 Delta Smelt from the FC&CL to Belden’s Landing boat ramp in Suisun Marsh for release into the Delta. This release will include 0% Adipose fin clipped individuals and 0% Visible Implant Elastomer tagged individuals. | |
| 2025-12-02 | Belden’s Landing boat ramp in Suisun Marsh | >200 | Hard Release (fish truck) | 0% | 0% | 35862 | On 2025-12-02, the USFWS will truck approximately ~35862 brood year 2025 Delta Smelt from the FC&CL to Belden’s Landing boat ramp in Suisun Marsh for release into the Delta. This release will include 0% Adipose fin clipped individuals and 0% Visible Implant Elastomer tagged individuals. | |
| 2025-11-05 | Belden’s Landing boat ramp in Suisun Marsh | >200 | Hard Release (fish truck) | 0% | 0% | 34551 | On 2025-11-05, the USFWS will truck approximately ~34551 brood year 2025 Delta Smelt from the FC&CL to Belden’s Landing boat ramp in Suisun Marsh for release into the Delta. This release will include 0% Adipose fin clipped individuals and 0% Visible Implant Elastomer tagged individuals. | |
| 2025-11-04 | Belden’s Landing boat ramp in Suisun Marsh | >200 | Hard Release (fish truck) | 0% | 0% | 33032 | On 2025-11-04, the USFWS will truck approximately ~33032 brood year 2025 Delta Smelt from the FC&CL to Belden’s Landing boat ramp in Suisun Marsh for release into the Delta. This release will include 0% Adipose fin clipped individuals and 0% Visible Implant Elastomer tagged individuals. |
Summary Tables
Smelt Monitoring Last 2 Weeks
| Monitoring | Species | Life Stage | First Date | Last Date | nfish | SacPAS Max Possible Date | SacPAS Data Retrieval Method |
|---|---|---|---|---|---|---|---|
| EDSM | Longfin Smelt | NA | 2026-04-17 | 2026-04-17 | 50 | 2026-04-24 | Daily. Data are preliminary and are subject to correction and revision. |
| EDSM | Longfin Smelt | Larva | 2026-04-17 | 2026-04-22 | 141 | 2026-04-24 | Daily. Data are preliminary and are subject to correction and revision. |
| EDSM | Longfin Smelt | Juvenile | 2026-04-17 | 2026-04-22 | 74 | 2026-04-24 | Daily. Data are preliminary and are subject to correction and revision. |
| EDSM | Longfin Smelt | All Catch | 2026-04-17 | 2026-04-22 | 265 | 2026-04-24 | Daily. Data are preliminary and are subject to correction and revision. |
Table only displays species collected in the previous two weeks.
Smelt Monitoring Water Year
| Monitoring | Species | Life Stage | First Date | Last Date | nfish | SacPAS Max Possible Date | SacPAS Data Retrieval Method |
|---|---|---|---|---|---|---|---|
| Chipps Island Trawl | Delta Smelt | Adult | 2026-01-22 | 2026-01-22 | 1 | 2026-05-01 | Daily. Data are preliminary and are subject to correction and revision. |
| Chipps Island Trawl | Delta Smelt | All Catch | 2026-01-22 | 2026-01-22 | 1 | 2026-05-01 | Daily. Data are preliminary and are subject to correction and revision. |
| Chipps Island Trawl | Longfin Smelt | Juvenile | 2025-11-25 | 2026-03-12 | 31 | 2026-05-01 | Daily. Data are preliminary and are subject to correction and revision. |
| Chipps Island Trawl | Longfin Smelt | Adult | 2025-11-25 | 2026-03-12 | 267 | 2026-05-01 | Daily. Data are preliminary and are subject to correction and revision. |
| Chipps Island Trawl | Longfin Smelt | All Catch | 2025-11-25 | 2026-03-12 | 303 | 2026-05-01 | Daily. Data are preliminary and are subject to correction and revision. |
| EDSM | Delta Smelt | Juvenile | 2025-10-06 | 2026-02-25 | 29 | 2026-04-24 | Daily. Data are preliminary and are subject to correction and revision. |
| EDSM | Delta Smelt | Adult | 2025-10-17 | 2026-03-24 | 42 | 2026-04-24 | Daily. Data are preliminary and are subject to correction and revision. |
| EDSM | Delta Smelt | All Catch | 2025-10-06 | 2026-03-24 | 71 | 2026-04-24 | Daily. Data are preliminary and are subject to correction and revision. |
| EDSM | Longfin Smelt | NA | 2026-01-20 | 2026-04-17 | 282 | 2026-04-24 | Daily. Data are preliminary and are subject to correction and revision. |
| EDSM | Longfin Smelt | Larva | 2026-03-30 | 2026-04-22 | 667 | 2026-04-24 | Daily. Data are preliminary and are subject to correction and revision. |
| EDSM | Longfin Smelt | Juvenile | 2025-10-02 | 2026-04-22 | 419 | 2026-04-24 | Daily. Data are preliminary and are subject to correction and revision. |
| EDSM | Longfin Smelt | Adult | 2025-10-27 | 2026-03-25 | 108 | 2026-04-24 | Daily. Data are preliminary and are subject to correction and revision. |
| EDSM | Longfin Smelt | All Catch | 2025-10-02 | 2026-04-22 | 1476 | 2026-04-24 | Daily. Data are preliminary and are subject to correction and revision. |
Smelt Salvage Last 2 Weeks
No Delta Smelt or Longfin Smelt caught in SWP and CVP Facilities last 2 weeks. Based on daily retrieval of CDFW Salvage DB.
SacPAS Max Possible Date: 2026-04-29
Smelt Salvage Water Year
| Monitoring | Species | First Date | Last Date | nfish | SacPAS Max Possible Date | SacPAS Data Retrieval Method |
|---|---|---|---|---|---|---|
| SWP/CVP Salvage | Delta Smelt | 2026-03-06 | 2026-03-06 | 1 | 2026-04-29 | Daily retrieval of CDFW Salvage DB |
Figures
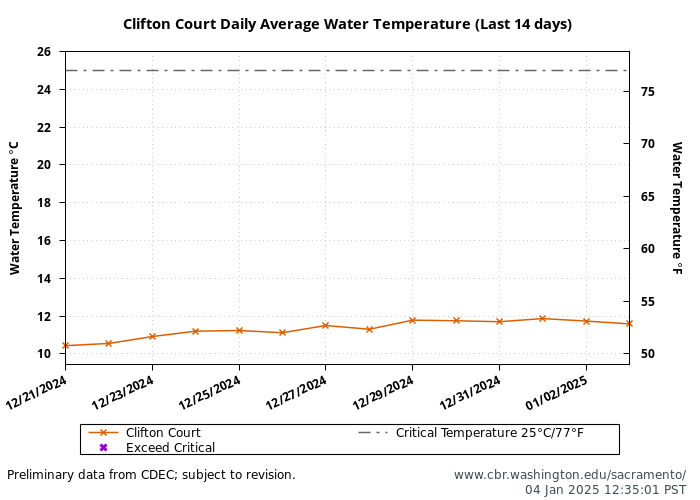
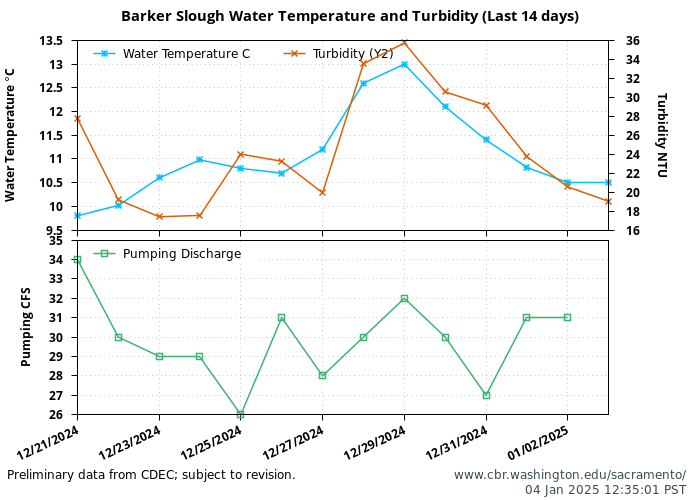
Water Temperature
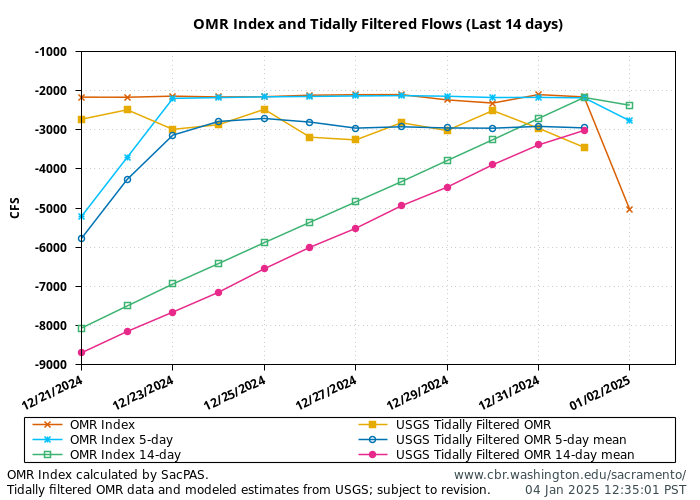
Onset of OMR Management
The information on OMR Managment on this website is summarized for Delta Smelt from the OMR Entrainment Management Guidance Document and does not reflect a comprehensive description of each of the OMR actions.
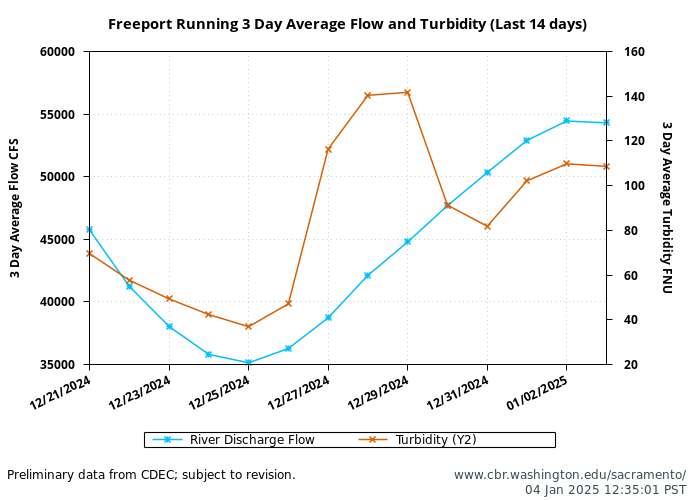
"First Flush" conditions may be triggered between December 1 and January 31 and include: Running 3-day average of the daily flows at Freeport is greater than 25,000 cfs and running 3-day average of the daily turbidity at Freeport is 50 NTU or greater, or real-time monitoring indicates a high risk of migration and dispersal into areas at high risk of future entrainment. This "First Flush" may only be initiated once during the December through January period and will not be required if: spent female Delta Smelt are collected in monitoring surveys.
Turbidity Bridge Avoidance
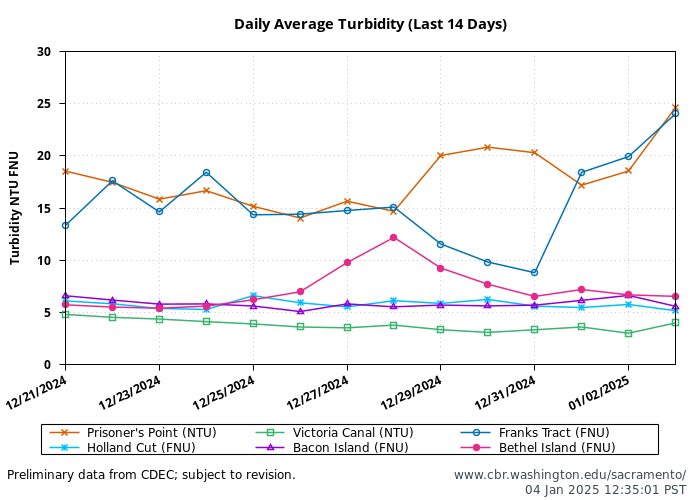
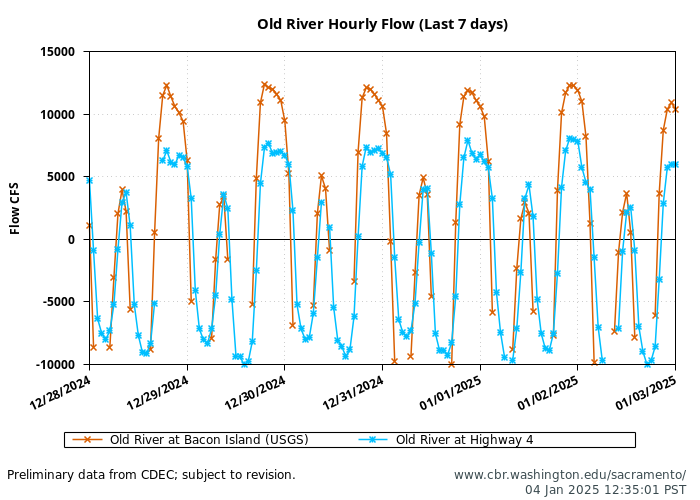
Turbidity Bridge Avoidance ("South Delta Turbidity"): After the Integrated Early Winter Pulse Protection (above) or February 1 (whichever comes first) and until a ripe or spent female is detected or April 1 (whichever is first), Reclamation and DWR propose to manage exports in order to maintain daily average turbidity in Old River at Bacon Island (OBI) at a level of less than 12 NTU. Reclamation and DWR recognize that readings at individual sensors or localized groups of sensors can generate spurious results in real-time. To avoid triggering an OMR flow action during a sensor error or a localized turbidity spike that might be caused by local flows or a wind-driven event, Reclamation and DWR will consider and review data from other locations.
Larval and Juvenile Delta Smelt Protection
End of OMR Management
OMR criteria may control operations until June 30 (for Delta Smelt and Chinook salmon), until June 15 (for steelhead/rainbow trout), or when the following species-specific off ramps have occurred, whichever is earlier.
Delta Smelt: when the daily mean water temperature at CCF reaches 77°F for 3 consecutive days. 77°F is equal to 25°C.
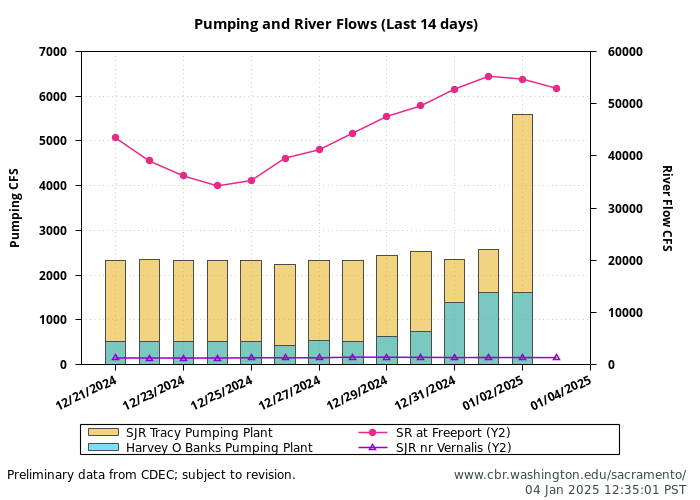
Operations and Hydrology
Water Year Tables
USFWS Chipps Island Trawl
| Date | Species | Mark Code | nfish | Fork Length | Life Stage | Station Code | Sample Time | Source |
|---|---|---|---|---|---|---|---|---|
| 2026-01-22 | Delta Smelt | None | 1 | 74 | Adult | SB018N | 12:03:00 | Data are preliminary and are subject to correction and revision. |
| 2025-11-25 | Longfin Smelt | None | 1 | 70 | Juvenile | SB018N | 07:45:00 | Data are preliminary and are subject to correction and revision. |
| 2025-11-25 | Longfin Smelt | None | 1 | 104 | Adult | SB018N | 07:45:00 | Data are preliminary and are subject to correction and revision. |
| 2025-12-01 | Longfin Smelt | None | 1 | 75 | Juvenile | SB018M | 09:09:00 | Data are preliminary and are subject to correction and revision. |
| 2025-12-01 | Longfin Smelt | None | 1 | 95 | Adult | SB018M | 09:09:00 | Data are preliminary and are subject to correction and revision. |
| 2025-12-01 | Longfin Smelt | None | 1 | 97 | Adult | SB018M | 09:09:00 | Data are preliminary and are subject to correction and revision. |
| 2025-12-01 | Longfin Smelt | None | 1 | 100 | Adult | SB018M | 09:09:00 | Data are preliminary and are subject to correction and revision. |
| 2025-12-01 | Longfin Smelt | None | 1 | 99 | Adult | SB018S | 10:59:00 | Data are preliminary and are subject to correction and revision. |
| 2025-12-01 | Longfin Smelt | None | 1 | 113 | Adult | SB018M | 09:09:00 | Data are preliminary and are subject to correction and revision. |
| 2025-12-01 | Longfin Smelt | None | 1 | 104 | Adult | SB018M | 09:09:00 | Data are preliminary and are subject to correction and revision. |
| 2025-12-01 | Longfin Smelt | None | 1 | 71 | Juvenile | SB018N | 11:55:00 | Data are preliminary and are subject to correction and revision. |
| 2025-12-01 | Longfin Smelt | None | 1 | 104 | Adult | SB018M | 08:44:00 | Data are preliminary and are subject to correction and revision. |
| 2025-12-01 | Longfin Smelt | None | 1 | 59 | Juvenile | SB018S | 10:06:00 | Data are preliminary and are subject to correction and revision. |
| 2025-12-01 | Longfin Smelt | None | 1 | 66 | Juvenile | SB018S | 10:06:00 | Data are preliminary and are subject to correction and revision. |
| 2025-12-01 | Longfin Smelt | None | 2 | 106 | Adult | SB018S | 10:06:00 | Data are preliminary and are subject to correction and revision. |
| 2025-12-01 | Longfin Smelt | None | 1 | 107 | Adult | SB018S | 10:06:00 | Data are preliminary and are subject to correction and revision. |
| 2025-12-01 | Longfin Smelt | None | 2 | 109 | Adult | SB018S | 10:06:00 | Data are preliminary and are subject to correction and revision. |
| 2025-12-01 | Longfin Smelt | None | 1 | 94 | Adult | SB018S | 10:59:00 | Data are preliminary and are subject to correction and revision. |
| 2025-12-01 | Longfin Smelt | None | 1 | 105 | Adult | SB018N | 12:20:00 | Data are preliminary and are subject to correction and revision. |
| 2025-12-01 | Longfin Smelt | None | 1 | 72 | Juvenile | SB018N | 11:55:00 | Data are preliminary and are subject to correction and revision. |
| 2025-12-04 | Longfin Smelt | None | 1 | NA | SB018M | 08:25:00 | Data are preliminary and are subject to correction and revision. | |
| 2025-12-08 | Longfin Smelt | None | 1 | 104 | Adult | SB018M | 08:20:00 | Data are preliminary and are subject to correction and revision. |
| 2025-12-10 | Longfin Smelt | None | 1 | NA | SB018N | 10:59:00 | Data are preliminary and are subject to correction and revision. | |
| 2025-12-10 | Longfin Smelt | None | 1 | 105 | Adult | SB018M | 09:40:00 | Data are preliminary and are subject to correction and revision. |
| 2025-12-10 | Longfin Smelt | None | 1 | 101 | Adult | SB018M | 10:07:00 | Data are preliminary and are subject to correction and revision. |
| 2025-12-10 | Longfin Smelt | None | 1 | 98 | Adult | SB018S | 08:47:00 | Data are preliminary and are subject to correction and revision. |
| 2025-12-10 | Longfin Smelt | None | 1 | 103 | Adult | SB018S | 07:57:00 | Data are preliminary and are subject to correction and revision. |
| 2025-12-10 | Longfin Smelt | None | 3 | NA | SB018M | 10:33:00 | Data are preliminary and are subject to correction and revision. | |
| 2025-12-12 | Longfin Smelt | None | 1 | 113 | Adult | SB018N | 08:06:00 | Data are preliminary and are subject to correction and revision. |
| 2025-12-12 | Longfin Smelt | None | 1 | 108 | Adult | SB018N | 08:06:00 | Data are preliminary and are subject to correction and revision. |
| 2025-12-12 | Longfin Smelt | None | 1 | 101 | Adult | SB018N | 08:06:00 | Data are preliminary and are subject to correction and revision. |
| 2025-12-12 | Longfin Smelt | None | 1 | 72 | Juvenile | SB018M | 09:51:00 | Data are preliminary and are subject to correction and revision. |
| 2025-12-12 | Longfin Smelt | None | 1 | 113 | Adult | SB018M | 09:51:00 | Data are preliminary and are subject to correction and revision. |
| 2025-12-12 | Longfin Smelt | None | 1 | 100 | Adult | SB018M | 10:17:00 | Data are preliminary and are subject to correction and revision. |
| 2025-12-12 | Longfin Smelt | None | 1 | 102 | Adult | SB018M | 10:17:00 | Data are preliminary and are subject to correction and revision. |
| 2025-12-12 | Longfin Smelt | None | 1 | 103 | Adult | SB018M | 10:17:00 | Data are preliminary and are subject to correction and revision. |
| 2025-12-12 | Longfin Smelt | None | 1 | 110 | Adult | SB018M | 10:17:00 | Data are preliminary and are subject to correction and revision. |
| 2025-12-12 | Longfin Smelt | None | 1 | 105 | Adult | SB018M | 10:42:00 | Data are preliminary and are subject to correction and revision. |
| 2025-12-12 | Longfin Smelt | None | 1 | 100 | Adult | SB018S | 12:02:00 | Data are preliminary and are subject to correction and revision. |
| 2025-12-12 | Longfin Smelt | None | 1 | 106 | Adult | SB018S | 11:36:00 | Data are preliminary and are subject to correction and revision. |
| 2025-12-12 | Longfin Smelt | None | 1 | 97 | Adult | SB018S | 11:36:00 | Data are preliminary and are subject to correction and revision. |
| 2025-12-12 | Longfin Smelt | None | 1 | 111 | Adult | SB018S | 11:11:00 | Data are preliminary and are subject to correction and revision. |
| 2025-12-12 | Longfin Smelt | None | 1 | 105 | Adult | SB018S | 11:11:00 | Data are preliminary and are subject to correction and revision. |
| 2025-12-12 | Longfin Smelt | None | 1 | 101 | Adult | SB018S | 11:11:00 | Data are preliminary and are subject to correction and revision. |
| 2025-12-12 | Longfin Smelt | None | 2 | 100 | Adult | SB018S | 11:11:00 | Data are preliminary and are subject to correction and revision. |
| 2025-12-12 | Longfin Smelt | None | 1 | 110 | Adult | SB018N | 09:23:00 | Data are preliminary and are subject to correction and revision. |
| 2025-12-12 | Longfin Smelt | None | 1 | 101 | Adult | SB018N | 08:58:00 | Data are preliminary and are subject to correction and revision. |
| 2025-12-12 | Longfin Smelt | None | 1 | 105 | Adult | SB018N | 08:32:00 | Data are preliminary and are subject to correction and revision. |
| 2025-12-12 | Longfin Smelt | None | 1 | 72 | Juvenile | SB018N | 08:32:00 | Data are preliminary and are subject to correction and revision. |
| 2025-12-12 | Longfin Smelt | None | 1 | 109 | Adult | SB018N | 08:06:00 | Data are preliminary and are subject to correction and revision. |
| 2025-12-15 | Longfin Smelt | None | 1 | 87 | Adult | SB018M | 10:20:00 | Data are preliminary and are subject to correction and revision. |
| 2025-12-15 | Longfin Smelt | None | 3 | 111 | Adult | SB018M | 09:54:00 | Data are preliminary and are subject to correction and revision. |
| 2025-12-15 | Longfin Smelt | None | 1 | 109 | Adult | SB018M | 09:54:00 | Data are preliminary and are subject to correction and revision. |
| 2025-12-15 | Longfin Smelt | None | 1 | 108 | Adult | SB018M | 09:54:00 | Data are preliminary and are subject to correction and revision. |
| 2025-12-15 | Longfin Smelt | None | 2 | 105 | Adult | SB018M | 09:54:00 | Data are preliminary and are subject to correction and revision. |
| 2025-12-15 | Longfin Smelt | None | 2 | 100 | Adult | SB018M | 09:54:00 | Data are preliminary and are subject to correction and revision. |
| 2025-12-15 | Longfin Smelt | None | 1 | 97 | Adult | SB018M | 09:54:00 | Data are preliminary and are subject to correction and revision. |
| 2025-12-15 | Longfin Smelt | None | 1 | 78 | Juvenile | SB018M | 09:54:00 | Data are preliminary and are subject to correction and revision. |
| 2025-12-15 | Longfin Smelt | None | 1 | 106 | Adult | SB018M | 09:27:00 | Data are preliminary and are subject to correction and revision. |
| 2025-12-15 | Longfin Smelt | None | 1 | 96 | Adult | SB018M | 09:27:00 | Data are preliminary and are subject to correction and revision. |
| 2025-12-15 | Longfin Smelt | None | 1 | 91 | Adult | SB018M | 10:45:00 | Data are preliminary and are subject to correction and revision. |
| 2025-12-15 | Longfin Smelt | None | 1 | 118 | Adult | SB018M | 10:20:00 | Data are preliminary and are subject to correction and revision. |
| 2025-12-15 | Longfin Smelt | None | 1 | 107 | Adult | SB018M | 10:20:00 | Data are preliminary and are subject to correction and revision. |
| 2025-12-15 | Longfin Smelt | None | 3 | 105 | Adult | SB018M | 10:20:00 | Data are preliminary and are subject to correction and revision. |
| 2025-12-15 | Longfin Smelt | None | 1 | 108 | Adult | SB018N | 12:01:00 | Data are preliminary and are subject to correction and revision. |
| 2025-12-15 | Longfin Smelt | None | 1 | 105 | Adult | SB018N | 12:01:00 | Data are preliminary and are subject to correction and revision. |
| 2025-12-15 | Longfin Smelt | None | 1 | 98 | Adult | SB018N | 12:01:00 | Data are preliminary and are subject to correction and revision. |
| 2025-12-15 | Longfin Smelt | None | 1 | 71 | Juvenile | SB018N | 12:01:00 | Data are preliminary and are subject to correction and revision. |
| 2025-12-15 | Longfin Smelt | None | 1 | 105 | Adult | SB018N | 11:34:00 | Data are preliminary and are subject to correction and revision. |
| 2025-12-15 | Longfin Smelt | None | 1 | 66 | Juvenile | SB018N | 11:34:00 | Data are preliminary and are subject to correction and revision. |
| 2025-12-15 | Longfin Smelt | None | 1 | 107 | Adult | SB018N | 11:11:00 | Data are preliminary and are subject to correction and revision. |
| 2025-12-15 | Longfin Smelt | None | 2 | 104 | Adult | SB018M | 10:20:00 | Data are preliminary and are subject to correction and revision. |
| 2025-12-17 | Longfin Smelt | None | 2 | 110 | Adult | SB018N | 10:54:00 | Data are preliminary and are subject to correction and revision. |
| 2025-12-17 | Longfin Smelt | None | 1 | 107 | Adult | SB018M | 08:20:00 | Data are preliminary and are subject to correction and revision. |
| 2025-12-17 | Longfin Smelt | None | 1 | 105 | Adult | SB018M | 08:46:00 | Data are preliminary and are subject to correction and revision. |
| 2025-12-17 | Longfin Smelt | None | 1 | 109 | Adult | SB018M | 08:46:00 | Data are preliminary and are subject to correction and revision. |
| 2025-12-17 | Longfin Smelt | None | 2 | 110 | Adult | SB018M | 08:46:00 | Data are preliminary and are subject to correction and revision. |
| 2025-12-17 | Longfin Smelt | None | 1 | 120 | Adult | SB018M | 08:46:00 | Data are preliminary and are subject to correction and revision. |
| 2025-12-17 | Longfin Smelt | None | 1 | 91 | Adult | SB018M | 09:12:00 | Data are preliminary and are subject to correction and revision. |
| 2025-12-17 | Longfin Smelt | None | 1 | 102 | Adult | SB018M | 09:12:00 | Data are preliminary and are subject to correction and revision. |
| 2025-12-17 | Longfin Smelt | None | 1 | 114 | Adult | SB018M | 09:12:00 | Data are preliminary and are subject to correction and revision. |
| 2025-12-17 | Longfin Smelt | None | 1 | 105 | Adult | SB018N | 10:33:00 | Data are preliminary and are subject to correction and revision. |
| 2025-12-17 | Longfin Smelt | None | 1 | 107 | Adult | SB018N | 10:33:00 | Data are preliminary and are subject to correction and revision. |
| 2025-12-17 | Longfin Smelt | None | 1 | 110 | Adult | SB018N | 10:33:00 | Data are preliminary and are subject to correction and revision. |
| 2025-12-17 | Longfin Smelt | None | 1 | 112 | Adult | SB018N | 10:33:00 | Data are preliminary and are subject to correction and revision. |
| 2025-12-17 | Longfin Smelt | None | 1 | 117 | Adult | SB018N | 10:33:00 | Data are preliminary and are subject to correction and revision. |
| 2025-12-17 | Longfin Smelt | None | 1 | 91 | Adult | SB018N | 10:54:00 | Data are preliminary and are subject to correction and revision. |
| 2025-12-17 | Longfin Smelt | None | 1 | 95 | Adult | SB018N | 10:54:00 | Data are preliminary and are subject to correction and revision. |
| 2025-12-17 | Longfin Smelt | None | 1 | 96 | Adult | SB018N | 10:54:00 | Data are preliminary and are subject to correction and revision. |
| 2025-12-17 | Longfin Smelt | None | 1 | 97 | Adult | SB018N | 10:54:00 | Data are preliminary and are subject to correction and revision. |
| 2025-12-17 | Longfin Smelt | None | 2 | 98 | Adult | SB018N | 10:54:00 | Data are preliminary and are subject to correction and revision. |
| 2025-12-17 | Longfin Smelt | None | 1 | 99 | Adult | SB018N | 10:54:00 | Data are preliminary and are subject to correction and revision. |
| 2025-12-17 | Longfin Smelt | None | 1 | 101 | Adult | SB018N | 10:54:00 | Data are preliminary and are subject to correction and revision. |
| 2025-12-17 | Longfin Smelt | None | 1 | 102 | Adult | SB018N | 10:54:00 | Data are preliminary and are subject to correction and revision. |
| 2025-12-17 | Longfin Smelt | None | 1 | 103 | Adult | SB018N | 10:54:00 | Data are preliminary and are subject to correction and revision. |
| 2025-12-17 | Longfin Smelt | None | 3 | 104 | Adult | SB018N | 10:54:00 | Data are preliminary and are subject to correction and revision. |
| 2025-12-17 | Longfin Smelt | None | 2 | 105 | Adult | SB018N | 10:54:00 | Data are preliminary and are subject to correction and revision. |
| 2025-12-17 | Longfin Smelt | None | 1 | 106 | Adult | SB018N | 10:54:00 | Data are preliminary and are subject to correction and revision. |
| 2025-12-17 | Longfin Smelt | None | 1 | 107 | Adult | SB018N | 10:54:00 | Data are preliminary and are subject to correction and revision. |
| 2025-12-17 | Longfin Smelt | None | 3 | 108 | Adult | SB018N | 10:54:00 | Data are preliminary and are subject to correction and revision. |
| 2025-12-17 | Longfin Smelt | None | 1 | 109 | Adult | SB018N | 10:54:00 | Data are preliminary and are subject to correction and revision. |
| 2025-12-17 | Longfin Smelt | None | 1 | 111 | Adult | SB018N | 10:54:00 | Data are preliminary and are subject to correction and revision. |
| 2025-12-17 | Longfin Smelt | None | 2 | 113 | Adult | SB018N | 10:54:00 | Data are preliminary and are subject to correction and revision. |
| 2025-12-17 | Longfin Smelt | None | 3 | 115 | Adult | SB018N | 10:54:00 | Data are preliminary and are subject to correction and revision. |
| 2025-12-17 | Longfin Smelt | None | 1 | 116 | Adult | SB018N | 10:54:00 | Data are preliminary and are subject to correction and revision. |
| 2025-12-17 | Longfin Smelt | None | 1 | 118 | Adult | SB018N | 10:54:00 | Data are preliminary and are subject to correction and revision. |
| 2025-12-17 | Longfin Smelt | None | 2 | 120 | Adult | SB018N | 10:54:00 | Data are preliminary and are subject to correction and revision. |
| 2025-12-22 | Longfin Smelt | None | 1 | 105 | Adult | SB018M | 09:06:00 | Data are preliminary and are subject to correction and revision. |
| 2025-12-22 | Longfin Smelt | None | 1 | 98 | Adult | SB018M | 09:06:00 | Data are preliminary and are subject to correction and revision. |
| 2025-12-29 | Longfin Smelt | None | 1 | 110 | Adult | SB018S | 11:44:00 | Data are preliminary and are subject to correction and revision. |
| 2025-12-29 | Longfin Smelt | None | 1 | 108 | Adult | SB018S | 11:44:00 | Data are preliminary and are subject to correction and revision. |
| 2025-12-29 | Longfin Smelt | None | 1 | 101 | Adult | SB018S | 11:44:00 | Data are preliminary and are subject to correction and revision. |
| 2025-12-29 | Longfin Smelt | None | 1 | 98 | Adult | SB018S | 11:44:00 | Data are preliminary and are subject to correction and revision. |
| 2025-12-29 | Longfin Smelt | None | 1 | 97 | Adult | SB018S | 11:44:00 | Data are preliminary and are subject to correction and revision. |
| 2025-12-29 | Longfin Smelt | None | 1 | 120 | Adult | SB018S | 10:53:00 | Data are preliminary and are subject to correction and revision. |
| 2025-12-29 | Longfin Smelt | None | 2 | 106 | Adult | SB018S | 10:53:00 | Data are preliminary and are subject to correction and revision. |
| 2025-12-29 | Longfin Smelt | None | 1 | 101 | Adult | SB018S | 10:53:00 | Data are preliminary and are subject to correction and revision. |
| 2025-12-29 | Longfin Smelt | None | 1 | 99 | Adult | SB018S | 10:53:00 | Data are preliminary and are subject to correction and revision. |
| 2025-12-29 | Longfin Smelt | None | 1 | 98 | Adult | SB018S | 10:53:00 | Data are preliminary and are subject to correction and revision. |
| 2025-12-29 | Longfin Smelt | None | 1 | 108 | Adult | SB018M | 12:09:00 | Data are preliminary and are subject to correction and revision. |
| 2025-12-29 | Longfin Smelt | None | 1 | 103 | Adult | SB018N | 09:59:00 | Data are preliminary and are subject to correction and revision. |
| 2025-12-29 | Longfin Smelt | None | 1 | 110 | Adult | SB018N | 09:59:00 | Data are preliminary and are subject to correction and revision. |
| 2025-12-29 | Longfin Smelt | None | 1 | 100 | Adult | SB018S | 10:28:00 | Data are preliminary and are subject to correction and revision. |
| 2025-12-29 | Longfin Smelt | None | 1 | 86 | Adult | SB018N | 09:32:00 | Data are preliminary and are subject to correction and revision. |
| 2025-12-29 | Longfin Smelt | None | 1 | 98 | Adult | SB018N | 09:32:00 | Data are preliminary and are subject to correction and revision. |
| 2025-12-29 | Longfin Smelt | None | 1 | 100 | Adult | SB018N | 09:32:00 | Data are preliminary and are subject to correction and revision. |
| 2025-12-29 | Longfin Smelt | None | 1 | 105 | Adult | SB018M | 12:09:00 | Data are preliminary and are subject to correction and revision. |
| 2025-12-29 | Longfin Smelt | None | 1 | 100 | Adult | SB018M | 12:09:00 | Data are preliminary and are subject to correction and revision. |
| 2025-12-29 | Longfin Smelt | None | 1 | 106 | Adult | SB018M | 12:09:00 | Data are preliminary and are subject to correction and revision. |
| 2025-12-30 | Longfin Smelt | None | 3 | 105 | Adult | SB018M | 12:18:00 | Data are preliminary and are subject to correction and revision. |
| 2025-12-30 | Longfin Smelt | None | 2 | 105 | Adult | SB018S | 11:02:00 | Data are preliminary and are subject to correction and revision. |
| 2025-12-30 | Longfin Smelt | None | 1 | 106 | Adult | SB018S | 11:02:00 | Data are preliminary and are subject to correction and revision. |
| 2025-12-30 | Longfin Smelt | None | 4 | 110 | Adult | SB018M | 12:18:00 | Data are preliminary and are subject to correction and revision. |
| 2025-12-30 | Longfin Smelt | None | 1 | 104 | Adult | SB018S | 11:02:00 | Data are preliminary and are subject to correction and revision. |
| 2025-12-30 | Longfin Smelt | None | 1 | 103 | Adult | SB018S | 11:02:00 | Data are preliminary and are subject to correction and revision. |
| 2025-12-30 | Longfin Smelt | None | 2 | 100 | Adult | SB018S | 11:02:00 | Data are preliminary and are subject to correction and revision. |
| 2025-12-30 | Longfin Smelt | None | 2 | 104 | Adult | SB018M | 12:18:00 | Data are preliminary and are subject to correction and revision. |
| 2025-12-30 | Longfin Smelt | None | 1 | 96 | Adult | SB018S | 11:02:00 | Data are preliminary and are subject to correction and revision. |
| 2025-12-30 | Longfin Smelt | None | 1 | 95 | Adult | SB018S | 11:02:00 | Data are preliminary and are subject to correction and revision. |
| 2025-12-30 | Longfin Smelt | None | 1 | 80 | Juvenile | SB018S | 11:02:00 | Data are preliminary and are subject to correction and revision. |
| 2025-12-30 | Longfin Smelt | None | 1 | 107 | Adult | SB018S | 10:35:00 | Data are preliminary and are subject to correction and revision. |
| 2025-12-30 | Longfin Smelt | None | 1 | 97 | Adult | SB018S | 10:35:00 | Data are preliminary and are subject to correction and revision. |
| 2025-12-30 | Longfin Smelt | None | 1 | 109 | Adult | SB018S | 10:07:00 | Data are preliminary and are subject to correction and revision. |
| 2025-12-30 | Longfin Smelt | None | 1 | 107 | Adult | SB018S | 10:07:00 | Data are preliminary and are subject to correction and revision. |
| 2025-12-30 | Longfin Smelt | None | 3 | 105 | Adult | SB018S | 10:07:00 | Data are preliminary and are subject to correction and revision. |
| 2025-12-30 | Longfin Smelt | None | 1 | 102 | Adult | SB018S | 10:07:00 | Data are preliminary and are subject to correction and revision. |
| 2025-12-30 | Longfin Smelt | None | 1 | 115 | Adult | SB018M | 11:52:00 | Data are preliminary and are subject to correction and revision. |
| 2025-12-30 | Longfin Smelt | None | 1 | 100 | Adult | SB018S | 10:07:00 | Data are preliminary and are subject to correction and revision. |
| 2025-12-30 | Longfin Smelt | None | 1 | 99 | Adult | SB018S | 10:07:00 | Data are preliminary and are subject to correction and revision. |
| 2025-12-30 | Longfin Smelt | None | 1 | 94 | Adult | SB018S | 10:07:00 | Data are preliminary and are subject to correction and revision. |
| 2025-12-30 | Longfin Smelt | None | 2 | 105 | Adult | SB018S | 09:42:00 | Data are preliminary and are subject to correction and revision. |
| 2025-12-30 | Longfin Smelt | None | 1 | 94 | Adult | SB018S | 09:42:00 | Data are preliminary and are subject to correction and revision. |
| 2025-12-30 | Longfin Smelt | None | 1 | 114 | Adult | SB018M | 11:52:00 | Data are preliminary and are subject to correction and revision. |
| 2025-12-30 | Longfin Smelt | None | 1 | 111 | Adult | SB018M | 11:52:00 | Data are preliminary and are subject to correction and revision. |
| 2025-12-30 | Longfin Smelt | None | 1 | 108 | Adult | SB018M | 11:52:00 | Data are preliminary and are subject to correction and revision. |
| 2025-12-30 | Longfin Smelt | None | 1 | 106 | Adult | SB018M | 11:52:00 | Data are preliminary and are subject to correction and revision. |
| 2025-12-30 | Longfin Smelt | None | 2 | 100 | Adult | SB018M | 11:52:00 | Data are preliminary and are subject to correction and revision. |
| 2025-12-30 | Longfin Smelt | None | 1 | 97 | Adult | SB018M | 11:52:00 | Data are preliminary and are subject to correction and revision. |
| 2025-12-30 | Longfin Smelt | None | 1 | 96 | Adult | SB018M | 11:52:00 | Data are preliminary and are subject to correction and revision. |
| 2025-12-30 | Longfin Smelt | None | 1 | 95 | Adult | SB018M | 11:52:00 | Data are preliminary and are subject to correction and revision. |
| 2025-12-30 | Longfin Smelt | None | 1 | 91 | Adult | SB018M | 11:52:00 | Data are preliminary and are subject to correction and revision. |
| 2025-12-30 | Longfin Smelt | None | 1 | 94 | Adult | SB018M | 11:27:00 | Data are preliminary and are subject to correction and revision. |
| 2025-12-30 | Longfin Smelt | None | 1 | 112 | Adult | SB018N | 12:43:00 | Data are preliminary and are subject to correction and revision. |
| 2025-12-30 | Longfin Smelt | None | 1 | 96 | Adult | SB018N | 13:08:00 | Data are preliminary and are subject to correction and revision. |
| 2025-12-30 | Longfin Smelt | None | 2 | 107 | Adult | SB018S | 11:02:00 | Data are preliminary and are subject to correction and revision. |
| 2025-12-30 | Longfin Smelt | None | 3 | 110 | Adult | SB018S | 11:02:00 | Data are preliminary and are subject to correction and revision. |
| 2025-12-30 | Longfin Smelt | None | 1 | 111 | Adult | SB018S | 11:02:00 | Data are preliminary and are subject to correction and revision. |
| 2025-12-30 | Longfin Smelt | None | 2 | 109 | Adult | SB018M | 12:18:00 | Data are preliminary and are subject to correction and revision. |
| 2025-12-31 | Longfin Smelt | None | 1 | 93 | Adult | SB018M | 11:17:00 | Data are preliminary and are subject to correction and revision. |
| 2025-12-31 | Longfin Smelt | None | 1 | 78 | Juvenile | SB018S | 09:58:00 | Data are preliminary and are subject to correction and revision. |
| 2025-12-31 | Longfin Smelt | None | 1 | 85 | Adult | SB018S | 09:58:00 | Data are preliminary and are subject to correction and revision. |
| 2025-12-31 | Longfin Smelt | None | 1 | 105 | Adult | SB018S | 09:58:00 | Data are preliminary and are subject to correction and revision. |
| 2025-12-31 | Longfin Smelt | None | 1 | 116 | Adult | SB018S | 09:58:00 | Data are preliminary and are subject to correction and revision. |
| 2025-12-31 | Longfin Smelt | None | 1 | 95 | Adult | SB018S | 10:26:00 | Data are preliminary and are subject to correction and revision. |
| 2025-12-31 | Longfin Smelt | None | 1 | 105 | Adult | SB018S | 10:26:00 | Data are preliminary and are subject to correction and revision. |
| 2025-12-31 | Longfin Smelt | None | 1 | 160 | Adult | SB018S | 10:26:00 | Data are preliminary and are subject to correction and revision. |
| 2025-12-31 | Longfin Smelt | None | 1 | 81 | Juvenile | SB018S | 10:50:00 | Data are preliminary and are subject to correction and revision. |
| 2025-12-31 | Longfin Smelt | None | 1 | 96 | Adult | SB018S | 10:50:00 | Data are preliminary and are subject to correction and revision. |
| 2025-12-31 | Longfin Smelt | None | 1 | 99 | Adult | SB018S | 10:50:00 | Data are preliminary and are subject to correction and revision. |
| 2025-12-31 | Longfin Smelt | None | 1 | 105 | Adult | SB018S | 10:50:00 | Data are preliminary and are subject to correction and revision. |
| 2025-12-31 | Longfin Smelt | None | 1 | 89 | Adult | SB018N | 08:05:00 | Data are preliminary and are subject to correction and revision. |
| 2025-12-31 | Longfin Smelt | None | 1 | 95 | Adult | SB018N | 08:05:00 | Data are preliminary and are subject to correction and revision. |
| 2025-12-31 | Longfin Smelt | None | 1 | 96 | Adult | SB018N | 08:05:00 | Data are preliminary and are subject to correction and revision. |
| 2025-12-31 | Longfin Smelt | None | 1 | 98 | Adult | SB018N | 08:05:00 | Data are preliminary and are subject to correction and revision. |
| 2025-12-31 | Longfin Smelt | None | 1 | 104 | Adult | SB018N | 08:05:00 | Data are preliminary and are subject to correction and revision. |
| 2025-12-31 | Longfin Smelt | None | 2 | 107 | Adult | SB018N | 08:05:00 | Data are preliminary and are subject to correction and revision. |
| 2025-12-31 | Longfin Smelt | None | 2 | 109 | Adult | SB018N | 08:05:00 | Data are preliminary and are subject to correction and revision. |
| 2025-12-31 | Longfin Smelt | None | 1 | 113 | Adult | SB018N | 08:05:00 | Data are preliminary and are subject to correction and revision. |
| 2025-12-31 | Longfin Smelt | None | 1 | 120 | Adult | SB018N | 08:05:00 | Data are preliminary and are subject to correction and revision. |
| 2025-12-31 | Longfin Smelt | None | 1 | 97 | Adult | SB018N | 08:34:00 | Data are preliminary and are subject to correction and revision. |
| 2025-12-31 | Longfin Smelt | None | 1 | 99 | Adult | SB018N | 08:34:00 | Data are preliminary and are subject to correction and revision. |
| 2025-12-31 | Longfin Smelt | None | 2 | 105 | Adult | SB018N | 08:34:00 | Data are preliminary and are subject to correction and revision. |
| 2025-12-31 | Longfin Smelt | None | 1 | 108 | Adult | SB018N | 08:34:00 | Data are preliminary and are subject to correction and revision. |
| 2025-12-31 | Longfin Smelt | None | 1 | 110 | Adult | SB018N | 08:34:00 | Data are preliminary and are subject to correction and revision. |
| 2025-12-31 | Longfin Smelt | None | 1 | 114 | Adult | SB018N | 08:34:00 | Data are preliminary and are subject to correction and revision. |
| 2025-12-31 | Longfin Smelt | None | 1 | 101 | Adult | SB018N | 09:00:00 | Data are preliminary and are subject to correction and revision. |
| 2025-12-31 | Longfin Smelt | None | 1 | 105 | Adult | SB018N | 09:00:00 | Data are preliminary and are subject to correction and revision. |
| 2025-12-31 | Longfin Smelt | None | 1 | 106 | Adult | SB018N | 09:00:00 | Data are preliminary and are subject to correction and revision. |
| 2025-12-31 | Longfin Smelt | None | 1 | 116 | Adult | SB018N | 09:00:00 | Data are preliminary and are subject to correction and revision. |
| 2025-12-31 | Longfin Smelt | None | 1 | 94 | Adult | SB018N | 09:28:00 | Data are preliminary and are subject to correction and revision. |
| 2025-12-31 | Longfin Smelt | None | 1 | 102 | Adult | SB018N | 09:28:00 | Data are preliminary and are subject to correction and revision. |
| 2025-12-31 | Longfin Smelt | None | 1 | 110 | Adult | SB018M | 12:10:00 | Data are preliminary and are subject to correction and revision. |
| 2025-12-31 | Longfin Smelt | None | 1 | 109 | Adult | SB018M | 12:10:00 | Data are preliminary and are subject to correction and revision. |
| 2025-12-31 | Longfin Smelt | None | 1 | 105 | Adult | SB018M | 12:10:00 | Data are preliminary and are subject to correction and revision. |
| 2025-12-31 | Longfin Smelt | None | 1 | 102 | Adult | SB018M | 12:10:00 | Data are preliminary and are subject to correction and revision. |
| 2025-12-31 | Longfin Smelt | None | 1 | 100 | Adult | SB018M | 12:10:00 | Data are preliminary and are subject to correction and revision. |
| 2025-12-31 | Longfin Smelt | None | 1 | 94 | Adult | SB018M | 12:10:00 | Data are preliminary and are subject to correction and revision. |
| 2025-12-31 | Longfin Smelt | None | 1 | 118 | Adult | SB018M | 11:43:00 | Data are preliminary and are subject to correction and revision. |
| 2025-12-31 | Longfin Smelt | None | 1 | 105 | Adult | SB018M | 11:17:00 | Data are preliminary and are subject to correction and revision. |
| 2025-12-31 | Longfin Smelt | None | 1 | 103 | Adult | SB018M | 11:17:00 | Data are preliminary and are subject to correction and revision. |
| 2025-12-31 | Longfin Smelt | None | 1 | 97 | Adult | SB018M | 11:17:00 | Data are preliminary and are subject to correction and revision. |
| 2026-01-05 | Longfin Smelt | None | 1 | 112 | Adult | SB018S | 10:50:00 | Data are preliminary and are subject to correction and revision. |
| 2026-01-06 | Longfin Smelt | None | 1 | 119 | Adult | SB018M | 09:17:00 | Data are preliminary and are subject to correction and revision. |
| 2026-01-08 | Longfin Smelt | None | 1 | 110 | Adult | SB018N | 08:40:00 | Data are preliminary and are subject to correction and revision. |
| 2026-01-08 | Longfin Smelt | None | 1 | 102 | Adult | SB018S | 11:40:00 | Data are preliminary and are subject to correction and revision. |
| 2026-01-08 | Longfin Smelt | None | 1 | 96 | Adult | SB018N | 08:15:00 | Data are preliminary and are subject to correction and revision. |
| 2026-01-28 | Longfin Smelt | None | 1 | 77 | Juvenile | SB018N | 10:07:00 | Data are preliminary and are subject to correction and revision. |
| 2026-01-28 | Longfin Smelt | None | 1 | 79 | Juvenile | SB018N | 10:33:00 | Data are preliminary and are subject to correction and revision. |
| 2026-01-28 | Longfin Smelt | None | 1 | 76 | Juvenile | SB018N | 10:33:00 | Data are preliminary and are subject to correction and revision. |
| 2026-01-28 | Longfin Smelt | None | 1 | 100 | Adult | SB018N | 10:07:00 | Data are preliminary and are subject to correction and revision. |
| 2026-02-02 | Longfin Smelt | None | 1 | 84 | Juvenile | SB018M | 09:02:00 | Data are preliminary and are subject to correction and revision. |
| 2026-02-02 | Longfin Smelt | None | 1 | 86 | Adult | SB018N | 12:10:00 | Data are preliminary and are subject to correction and revision. |
| 2026-02-17 | Longfin Smelt | None | 1 | 97 | Adult | SB018M | 10:38:00 | Data are preliminary and are subject to correction and revision. |
| 2026-02-25 | Longfin Smelt | None | 1 | 116 | Adult | SB018M | 09:06:00 | Data are preliminary and are subject to correction and revision. |
| 2026-02-25 | Longfin Smelt | None | 1 | 86 | Adult | SB018M | 09:57:00 | Data are preliminary and are subject to correction and revision. |
| 2026-02-25 | Longfin Smelt | None | 1 | 77 | Juvenile | SB018M | 09:06:00 | Data are preliminary and are subject to correction and revision. |
| 2026-02-25 | Longfin Smelt | None | 1 | 88 | Adult | SB018M | 09:06:00 | Data are preliminary and are subject to correction and revision. |
| 2026-02-26 | Longfin Smelt | None | 1 | 93 | Adult | SB018N | 08:57:00 | Data are preliminary and are subject to correction and revision. |
| 2026-02-26 | Longfin Smelt | None | 1 | 76 | Juvenile | SB018N | 08:57:00 | Data are preliminary and are subject to correction and revision. |
| 2026-02-27 | Longfin Smelt | None | 1 | 87 | Adult | SB018S | 09:57:00 | Data are preliminary and are subject to correction and revision. |
| 2026-03-02 | Longfin Smelt | None | 1 | 92 | Adult | SB018N | 09:09:00 | Data are preliminary and are subject to correction and revision. |
| 2026-03-03 | Longfin Smelt | None | 1 | 80 | Juvenile | SB018N | 09:58:00 | Data are preliminary and are subject to correction and revision. |
| 2026-03-03 | Longfin Smelt | None | 1 | 89 | Adult | SB018N | 09:10:00 | Data are preliminary and are subject to correction and revision. |
| 2026-03-03 | Longfin Smelt | None | 1 | 86 | Adult | SB018M | 11:35:00 | Data are preliminary and are subject to correction and revision. |
| 2026-03-04 | Longfin Smelt | None | 1 | 91 | Adult | SB018N | 10:44:00 | Data are preliminary and are subject to correction and revision. |
| 2026-03-04 | Longfin Smelt | None | 1 | 85 | Adult | SB018N | 10:20:00 | Data are preliminary and are subject to correction and revision. |
| 2026-03-04 | Longfin Smelt | None | 1 | 80 | Juvenile | SB018M | 08:35:00 | Data are preliminary and are subject to correction and revision. |
| 2026-03-04 | Longfin Smelt | None | 1 | 90 | Adult | SB018N | 10:44:00 | Data are preliminary and are subject to correction and revision. |
| 2026-03-05 | Longfin Smelt | None | 1 | 90 | Adult | SB018N | 12:01:00 | Data are preliminary and are subject to correction and revision. |
| 2026-03-05 | Longfin Smelt | None | 1 | 82 | Juvenile | SB018S | 08:58:00 | Data are preliminary and are subject to correction and revision. |
| 2026-03-08 | Longfin Smelt | None | 1 | 90 | Adult | SB018S | 08:27:00 | Data are preliminary and are subject to correction and revision. |
| 2026-03-08 | Longfin Smelt | None | 1 | 94 | Adult | SB018S | 08:03:00 | Data are preliminary and are subject to correction and revision. |
| 2026-03-08 | Longfin Smelt | None | 1 | 77 | Juvenile | SB018M | 10:27:00 | Data are preliminary and are subject to correction and revision. |
| 2026-03-08 | Longfin Smelt | None | 1 | 80 | Juvenile | SB018S | 08:03:00 | Data are preliminary and are subject to correction and revision. |
| 2026-03-08 | Longfin Smelt | None | 1 | 106 | Adult | SB018S | 08:03:00 | Data are preliminary and are subject to correction and revision. |
| 2026-03-09 | Longfin Smelt | None | 1 | 93 | Adult | SB018M | 08:13:00 | Data are preliminary and are subject to correction and revision. |
| 2026-03-09 | Longfin Smelt | None | 1 | 81 | Juvenile | SB018M | 08:37:00 | Data are preliminary and are subject to correction and revision. |
| 2026-03-09 | Longfin Smelt | None | 1 | 95 | Adult | SB018M | 08:37:00 | Data are preliminary and are subject to correction and revision. |
| 2026-03-09 | Longfin Smelt | None | 1 | 95 | Adult | SB018M | 09:00:00 | Data are preliminary and are subject to correction and revision. |
| 2026-03-09 | Longfin Smelt | None | 1 | 95 | Adult | SB018N | 09:48:00 | Data are preliminary and are subject to correction and revision. |
| 2026-03-09 | Longfin Smelt | None | 1 | 79 | Juvenile | SB018M | 08:13:00 | Data are preliminary and are subject to correction and revision. |
| 2026-03-10 | Longfin Smelt | None | 1 | 104 | Adult | SB018S | 09:20:00 | Data are preliminary and are subject to correction and revision. |
| 2026-03-10 | Longfin Smelt | None | 1 | 92 | Adult | SB018N | 08:52:00 | Data are preliminary and are subject to correction and revision. |
| 2026-03-10 | Longfin Smelt | None | 1 | 83 | Juvenile | SB018N | 08:52:00 | Data are preliminary and are subject to correction and revision. |
| 2026-03-10 | Longfin Smelt | None | 1 | 79 | Juvenile | SB018N | 08:26:00 | Data are preliminary and are subject to correction and revision. |
| 2026-03-10 | Longfin Smelt | None | 1 | 78 | Juvenile | SB018N | 08:26:00 | Data are preliminary and are subject to correction and revision. |
| 2026-03-10 | Longfin Smelt | None | 1 | 104 | Adult | SB018N | 07:59:00 | Data are preliminary and are subject to correction and revision. |
| 2026-03-10 | Longfin Smelt | None | 1 | 102 | Adult | SB018S | 09:20:00 | Data are preliminary and are subject to correction and revision. |
| 2026-03-12 | Longfin Smelt | None | 1 | 86 | Adult | SB018N | 09:36:00 | Data are preliminary and are subject to correction and revision. |
| 2026-03-12 | Longfin Smelt | None | 1 | 80 | Juvenile | SB018N | 09:11:00 | Data are preliminary and are subject to correction and revision. |
EDSM
| Sample Date Time | Species | Mark Code | nfish | Fork Length (mm) | Life Stage | Subregion | Stratum | Region | Method | Source |
|---|---|---|---|---|---|---|---|---|---|---|
| 2025-10-06 11:30:00 | Delta Smelt | None | 1 | 54 | Juvenile | Lower Sacramento River | Lower Sacramento | West | KDTR | EDSM EDI Final, USFWS Lodi |
| 2025-10-09 09:21:00 | Delta Smelt | None | 1 | 54 | Juvenile | Suisun Marsh | Suisun Marsh | West | KDTR | EDSM EDI Final, USFWS Lodi |
| 2025-10-17 12:27:00 | Delta Smelt | None | 1 | 59 | Adult | Suisun Marsh | Suisun Marsh | West | KDTR | EDSM EDI Final, USFWS Lodi |
| 2025-11-06 08:57:00 | Delta Smelt | None | 1 | 53 | Juvenile | Grizzly Bay | Suisun Marsh | West | KDTR | EDSM EDI Final, USFWS Lodi |
| 2025-11-06 09:37:00 | Delta Smelt | None | 1 | 55 | Juvenile | Suisun Marsh | Suisun Marsh | West | KDTR | EDSM EDI Final, USFWS Lodi |
| 2025-11-06 09:37:00 | Delta Smelt | None | 1 | 62 | Adult | Suisun Marsh | Suisun Marsh | West | KDTR | EDSM EDI Final, USFWS Lodi |
| 2025-11-06 09:37:00 | Delta Smelt | None | 1 | 66 | Adult | Suisun Marsh | Suisun Marsh | West | KDTR | EDSM EDI Final, USFWS Lodi |
| 2025-11-06 10:01:00 | Delta Smelt | None | 1 | 45 | Juvenile | Suisun Marsh | Suisun Marsh | West | KDTR | EDSM EDI Final, USFWS Lodi |
| 2025-11-06 10:01:00 | Delta Smelt | None | 3 | 50 | Juvenile | Suisun Marsh | Suisun Marsh | West | KDTR | EDSM EDI Final, USFWS Lodi |
| 2025-11-06 10:01:00 | Delta Smelt | None | 1 | 51 | Juvenile | Suisun Marsh | Suisun Marsh | West | KDTR | EDSM EDI Final, USFWS Lodi |
| 2025-11-06 10:01:00 | Delta Smelt | None | 1 | 53 | Juvenile | Suisun Marsh | Suisun Marsh | West | KDTR | EDSM EDI Final, USFWS Lodi |
| 2025-11-06 10:01:00 | Delta Smelt | None | 1 | 54 | Juvenile | Suisun Marsh | Suisun Marsh | West | KDTR | EDSM EDI Final, USFWS Lodi |
| 2025-11-06 10:01:00 | Delta Smelt | None | 1 | 56 | Juvenile | Suisun Marsh | Suisun Marsh | West | KDTR | EDSM EDI Final, USFWS Lodi |
| 2025-11-06 10:01:00 | Delta Smelt | None | 1 | 59 | Adult | Suisun Marsh | Suisun Marsh | West | KDTR | EDSM EDI Final, USFWS Lodi |
| 2025-11-06 10:01:00 | Delta Smelt | None | 1 | 64 | Adult | Suisun Marsh | Suisun Marsh | West | KDTR | EDSM EDI Final, USFWS Lodi |
| 2025-11-06 10:01:00 | Delta Smelt | None | 2 | 66 | Adult | Suisun Marsh | Suisun Marsh | West | KDTR | EDSM EDI Final, USFWS Lodi |
| 2025-11-06 10:01:00 | Delta Smelt | None | 1 | 67 | Adult | Suisun Marsh | Suisun Marsh | West | KDTR | EDSM EDI Final, USFWS Lodi |
| 2025-11-06 10:01:00 | Delta Smelt | None | 2 | 71 | Adult | Suisun Marsh | Suisun Marsh | West | KDTR | EDSM EDI Final, USFWS Lodi |
| 2025-11-10 10:14:00 | Delta Smelt | None | 1 | 59 | Adult | Suisun Marsh | Suisun Marsh | West | KDTR | EDSM EDI Final, USFWS Lodi |
| 2025-11-10 10:14:00 | Delta Smelt | None | 1 | 61 | Adult | Suisun Marsh | Suisun Marsh | West | KDTR | EDSM EDI Final, USFWS Lodi |
| 2025-11-10 10:33:00 | Delta Smelt | None | 1 | 60 | Adult | Suisun Marsh | Suisun Marsh | West | KDTR | EDSM EDI Final, USFWS Lodi |
| 2025-11-10 10:33:00 | Delta Smelt | None | 1 | 64 | Adult | Suisun Marsh | Suisun Marsh | West | KDTR | EDSM EDI Final, USFWS Lodi |
| 2025-11-10 11:45:00 | Delta Smelt | None | 1 | 56 | Juvenile | Suisun Marsh | Suisun Marsh | West | KDTR | EDSM EDI Final, USFWS Lodi |
| 2025-11-17 09:12:00 | Delta Smelt | None | 1 | 66 | Adult | Grizzly Bay | Suisun Marsh | West | KDTR | EDSM EDI Final, USFWS Lodi |
| 2025-11-20 08:56:00 | Delta Smelt | None | 1 | 60 | Adult | Suisun Marsh | Suisun Marsh | West | KDTR | EDSM EDI Final, USFWS Lodi |
| 2025-11-20 09:12:00 | Delta Smelt | None | 1 | 62 | Adult | Suisun Marsh | Suisun Marsh | West | KDTR | EDSM EDI Final, USFWS Lodi |
| 2025-11-20 09:12:00 | Delta Smelt | None | 1 | 74 | Adult | Suisun Marsh | Suisun Marsh | West | KDTR | EDSM EDI Final, USFWS Lodi |
| 2025-12-01 09:16:00 | Delta Smelt | None | 1 | 66 | Adult | Suisun Marsh | Suisun Marsh | West | Kodiak Trawl | EDSM Provisional, USFWS Lodi |
| 2025-12-04 13:32:00 | Delta Smelt | None | 1 | 73 | Adult | Lower Sac River Ship Channel | Sac Deep Water | North | Kodiak Trawl | EDSM Provisional, USFWS Lodi |
| 2025-12-09 08:41:00 | Delta Smelt | None | 1 | 74 | Adult | Suisun Marsh | Suisun Marsh | West | Kodiak Trawl | EDSM Provisional, USFWS Lodi |
| 2025-12-09 08:57:00 | Delta Smelt | None | 1 | 69 | Adult | Suisun Marsh | Suisun Marsh | West | Kodiak Trawl | EDSM Provisional, USFWS Lodi |
| 2025-12-09 09:44:00 | Delta Smelt | None | 1 | 61 | Adult | Suisun Marsh | Suisun Marsh | West | Kodiak Trawl | EDSM Provisional, USFWS Lodi |
| 2025-12-11 10:42:00 | Delta Smelt | None | 1 | 55 | Juvenile | Suisun Marsh | Suisun Marsh | West | Kodiak Trawl | EDSM Provisional, USFWS Lodi |
| 2025-12-11 10:42:00 | Delta Smelt | None | 1 | 56 | Juvenile | Suisun Marsh | Suisun Marsh | West | Kodiak Trawl | EDSM Provisional, USFWS Lodi |
| 2025-12-11 10:42:00 | Delta Smelt | None | 1 | 57 | Juvenile | Suisun Marsh | Suisun Marsh | West | Kodiak Trawl | EDSM Provisional, USFWS Lodi |
| 2025-12-11 10:42:00 | Delta Smelt | None | 1 | 70 | Adult | Suisun Marsh | Suisun Marsh | West | Kodiak Trawl | EDSM Provisional, USFWS Lodi |
| 2025-12-11 12:26:00 | Delta Smelt | None | 1 | 59 | Adult | Suisun Marsh | Suisun Marsh | West | Kodiak Trawl | EDSM Provisional, USFWS Lodi |
| 2025-12-16 09:54:00 | Delta Smelt | None | 1 | 57 | Juvenile | Suisun Marsh | Suisun Marsh | West | Kodiak Trawl | EDSM Provisional, USFWS Lodi |
| 2025-12-16 11:08:00 | Delta Smelt | None | 1 | 47 | Juvenile | Suisun Marsh | Suisun Marsh | West | Kodiak Trawl | EDSM Provisional, USFWS Lodi |
| 2025-12-21 10:06:00 | Delta Smelt | None | 1 | 54 | Juvenile | Suisun Marsh | Suisun Marsh | West | Kodiak Trawl | EDSM Provisional, USFWS Lodi |
| 2025-12-21 11:27:00 | Delta Smelt | None | 1 | 55 | Juvenile | Suisun Marsh | Suisun Marsh | West | Kodiak Trawl | EDSM Provisional, USFWS Lodi |
| 2025-12-29 08:44:00 | Delta Smelt | None | 1 | 78 | Adult | Grizzly Bay | Suisun Marsh | West | Kodiak Trawl | EDSM Provisional, USFWS Lodi |
| 2025-12-29 11:35:00 | Delta Smelt | None | 1 | 59 | Adult | Suisun Marsh | Suisun Marsh | West | Kodiak Trawl | EDSM Provisional, USFWS Lodi |
| 2026-01-02 09:03:00 | Delta Smelt | None | 1 | 61 | Adult | Suisun Marsh | Suisun Marsh | West | Kodiak Trawl | EDSM Provisional, USFWS Lodi |
| 2026-01-02 10:04:00 | Delta Smelt | None | 1 | 48 | Juvenile | Suisun Marsh | Suisun Marsh | West | Kodiak Trawl | EDSM Provisional, USFWS Lodi |
| 2026-01-02 10:20:00 | Delta Smelt | None | 1 | 63 | Adult | Suisun Marsh | Suisun Marsh | West | Kodiak Trawl | EDSM Provisional, USFWS Lodi |
| 2026-01-07 08:27:00 | Delta Smelt | None | 1 | 68 | Adult | Grizzly Bay | Suisun Marsh | West | Kodiak Trawl | EDSM Provisional, USFWS Lodi |
| 2026-01-07 10:42:00 | Delta Smelt | None | 1 | 53 | Juvenile | Suisun Marsh | Suisun Marsh | West | Kodiak Trawl | EDSM Provisional, USFWS Lodi |
| 2026-01-08 08:55:00 | Delta Smelt | None | 1 | 62 | Adult | Suisun Marsh | Suisun Marsh | West | Kodiak Trawl | EDSM Provisional, USFWS Lodi |
| 2026-01-08 09:18:00 | Delta Smelt | None | 1 | 71 | Adult | Suisun Marsh | Suisun Marsh | West | Kodiak Trawl | EDSM Provisional, USFWS Lodi |
| 2026-01-08 09:34:00 | Delta Smelt | None | 1 | 54 | Juvenile | Suisun Marsh | Suisun Marsh | West | Kodiak Trawl | EDSM Provisional, USFWS Lodi |
| 2026-01-08 09:34:00 | Delta Smelt | None | 1 | 75 | Adult | Suisun Marsh | Suisun Marsh | West | Kodiak Trawl | EDSM Provisional, USFWS Lodi |
| 2026-01-22 10:03:00 | Delta Smelt | None | 1 | 74 | Adult | Lower Sac River Ship Channel | Sac Deep Water | North | Kodiak Trawl | EDSM Provisional, USFWS Lodi |
| 2026-01-27 11:19:00 | Delta Smelt | None | 1 | 53 | Juvenile | Suisun Marsh | Suisun Marsh | West | Kodiak Trawl | EDSM Provisional, USFWS Lodi |
| 2026-02-06 13:59:00 | Delta Smelt | None | 1 | 71 | Adult | Suisun Marsh | Suisun Marsh | West | Kodiak Trawl | EDSM Provisional, USFWS Lodi |
| 2026-02-10 12:27:00 | Delta Smelt | None | 1 | 52 | Juvenile | Suisun Marsh | Suisun Marsh | West | Kodiak Trawl | EDSM Provisional, USFWS Lodi |
| 2026-02-10 12:27:00 | Delta Smelt | None | 1 | 53 | Juvenile | Suisun Marsh | Suisun Marsh | West | Kodiak Trawl | EDSM Provisional, USFWS Lodi |
| 2026-02-10 12:27:00 | Delta Smelt | None | 1 | 55 | Juvenile | Suisun Marsh | Suisun Marsh | West | Kodiak Trawl | EDSM Provisional, USFWS Lodi |
| 2026-02-10 12:27:00 | Delta Smelt | None | 1 | 56 | Juvenile | Suisun Marsh | Suisun Marsh | West | Kodiak Trawl | EDSM Provisional, USFWS Lodi |
| 2026-02-25 11:20:00 | Delta Smelt | None | 1 | 54 | Juvenile | Suisun Marsh | Suisun Marsh | West | Kodiak Trawl | EDSM Provisional, USFWS Lodi |
| 2026-02-25 11:36:00 | Delta Smelt | None | 1 | 65 | Adult | Suisun Marsh | Suisun Marsh | West | Kodiak Trawl | EDSM Provisional, USFWS Lodi |
| 2026-02-25 12:35:00 | Delta Smelt | None | 1 | 62 | Adult | Suisun Marsh | Suisun Marsh | West | Kodiak Trawl | EDSM Provisional, USFWS Lodi |
| 2026-02-25 12:35:00 | Delta Smelt | None | 1 | 72 | Adult | Suisun Marsh | Suisun Marsh | West | Kodiak Trawl | EDSM Provisional, USFWS Lodi |
| 2026-03-02 10:36:00 | Delta Smelt | None | 1 | 68 | Adult | Suisun Marsh | Suisun Marsh | West | Kodiak Trawl | EDSM Provisional, USFWS Lodi |
| 2026-03-09 12:22:00 | Delta Smelt | None | 1 | 80 | Adult | Suisun Marsh | Suisun Marsh | West | Kodiak Trawl | EDSM Provisional, USFWS Lodi |
| 2026-03-18 11:09:00 | Delta Smelt | None | 1 | 71 | Adult | Suisun Marsh | Suisun Marsh | West | Kodiak Trawl | EDSM Provisional, USFWS Lodi |
| 2026-03-24 11:10:00 | Delta Smelt | None | 1 | 70 | Adult | Suisun Marsh | Suisun Marsh | West | Kodiak Trawl | EDSM Provisional, USFWS Lodi |
| 2025-10-02 10:44:00 | Longfin Smelt | None | 1 | 61 | Juvenile | Grizzly Bay | Suisun Marsh | West | KDTR | EDSM EDI Final, USFWS Lodi |
| 2025-10-16 09:43:00 | Longfin Smelt | None | 1 | 50 | Juvenile | Honker Bay | Suisun Bay | West | KDTR | EDSM EDI Final, USFWS Lodi |
| 2025-10-20 08:12:00 | Longfin Smelt | None | 1 | 57 | Juvenile | Grizzly Bay | Suisun Marsh | West | KDTR | EDSM EDI Final, USFWS Lodi |
| 2025-10-27 10:22:00 | Longfin Smelt | None | 1 | 59 | Juvenile | West Suisun Bay | Suisun Bay | Far West | KDTR | EDSM EDI Final, USFWS Lodi |
| 2025-10-27 10:38:00 | Longfin Smelt | None | 1 | 57 | Juvenile | West Suisun Bay | Suisun Bay | Far West | KDTR | EDSM EDI Final, USFWS Lodi |
| 2025-10-27 10:38:00 | Longfin Smelt | None | 1 | 61 | Juvenile | West Suisun Bay | Suisun Bay | Far West | KDTR | EDSM EDI Final, USFWS Lodi |
| 2025-10-27 10:38:00 | Longfin Smelt | None | 1 | 64 | Juvenile | West Suisun Bay | Suisun Bay | Far West | KDTR | EDSM EDI Final, USFWS Lodi |
| 2025-10-27 10:38:00 | Longfin Smelt | None | 1 | 87 | Adult | West Suisun Bay | Suisun Bay | Far West | KDTR | EDSM EDI Final, USFWS Lodi |
| 2025-10-30 08:06:00 | Longfin Smelt | None | 1 | 58 | Juvenile | Grizzly Bay | Suisun Marsh | West | KDTR | EDSM EDI Final, USFWS Lodi |
| 2025-10-30 08:21:00 | Longfin Smelt | None | 1 | 102 | Adult | Grizzly Bay | Suisun Marsh | West | KDTR | EDSM EDI Final, USFWS Lodi |
| 2025-10-30 10:51:00 | Longfin Smelt | None | 1 | 64 | Juvenile | Suisun Marsh | Suisun Marsh | West | KDTR | EDSM EDI Final, USFWS Lodi |
| 2025-11-03 08:59:00 | Longfin Smelt | None | 1 | 70 | Juvenile | Grizzly Bay | Suisun Marsh | West | KDTR | EDSM EDI Final, USFWS Lodi |
| 2025-11-03 08:59:00 | Longfin Smelt | None | 1 | 71 | Juvenile | Grizzly Bay | Suisun Marsh | West | KDTR | EDSM EDI Final, USFWS Lodi |
| 2025-11-03 08:59:00 | Longfin Smelt | None | 1 | 92 | Adult | Grizzly Bay | Suisun Marsh | West | KDTR | EDSM EDI Final, USFWS Lodi |
| 2025-11-03 09:31:00 | Longfin Smelt | None | 1 | 95 | Adult | Grizzly Bay | Suisun Marsh | West | KDTR | EDSM EDI Final, USFWS Lodi |
| 2025-11-03 10:16:00 | Longfin Smelt | None | 1 | 59 | Juvenile | Suisun Marsh | Suisun Marsh | West | KDTR | EDSM EDI Final, USFWS Lodi |
| 2025-11-03 10:16:00 | Longfin Smelt | None | 1 | 61 | Juvenile | Suisun Marsh | Suisun Marsh | West | KDTR | EDSM EDI Final, USFWS Lodi |
| 2025-11-03 10:16:00 | Longfin Smelt | None | 1 | 62 | Juvenile | Suisun Marsh | Suisun Marsh | West | KDTR | EDSM EDI Final, USFWS Lodi |
| 2025-11-03 10:16:00 | Longfin Smelt | None | 1 | 69 | Juvenile | Suisun Marsh | Suisun Marsh | West | KDTR | EDSM EDI Final, USFWS Lodi |
| 2025-11-03 10:32:00 | Longfin Smelt | None | 1 | 61 | Juvenile | Suisun Marsh | Suisun Marsh | West | KDTR | EDSM EDI Final, USFWS Lodi |
| 2025-11-03 10:32:00 | Longfin Smelt | None | 1 | 71 | Juvenile | Suisun Marsh | Suisun Marsh | West | KDTR | EDSM EDI Final, USFWS Lodi |
| 2025-11-03 10:32:00 | Longfin Smelt | None | 1 | 95 | Adult | Suisun Marsh | Suisun Marsh | West | KDTR | EDSM EDI Final, USFWS Lodi |
| 2025-11-03 10:32:00 | Longfin Smelt | None | 1 | 100 | Adult | Suisun Marsh | Suisun Marsh | West | KDTR | EDSM EDI Final, USFWS Lodi |
| 2025-11-03 11:03:00 | Longfin Smelt | None | 1 | 63 | Juvenile | Suisun Marsh | Suisun Marsh | West | KDTR | EDSM EDI Final, USFWS Lodi |
| 2025-11-03 11:03:00 | Longfin Smelt | None | 1 | 65 | Juvenile | Suisun Marsh | Suisun Marsh | West | KDTR | EDSM EDI Final, USFWS Lodi |
| 2025-11-03 11:03:00 | Longfin Smelt | None | 1 | 68 | Juvenile | Suisun Marsh | Suisun Marsh | West | KDTR | EDSM EDI Final, USFWS Lodi |
| 2025-11-03 11:03:00 | Longfin Smelt | None | 1 | 71 | Juvenile | Suisun Marsh | Suisun Marsh | West | KDTR | EDSM EDI Final, USFWS Lodi |
| 2025-11-03 11:03:00 | Longfin Smelt | None | 1 | 73 | Juvenile | Suisun Marsh | Suisun Marsh | West | KDTR | EDSM EDI Final, USFWS Lodi |
| 2025-11-03 11:03:00 | Longfin Smelt | None | 1 | 82 | Juvenile | Suisun Marsh | Suisun Marsh | West | KDTR | EDSM EDI Final, USFWS Lodi |
| 2025-11-03 11:45:00 | Longfin Smelt | None | 1 | 67 | Juvenile | Suisun Marsh | Suisun Marsh | West | KDTR | EDSM EDI Final, USFWS Lodi |
| 2025-11-03 12:15:00 | Longfin Smelt | None | 1 | 68 | Juvenile | Suisun Marsh | Suisun Marsh | West | KDTR | EDSM EDI Final, USFWS Lodi |
| 2025-11-06 10:01:00 | Longfin Smelt | None | 1 | 63 | Juvenile | Suisun Marsh | Suisun Marsh | West | KDTR | EDSM EDI Final, USFWS Lodi |
| 2025-11-13 08:30:00 | Longfin Smelt | None | 1 | 74 | Juvenile | Grizzly Bay | Suisun Marsh | West | KDTR | EDSM EDI Final, USFWS Lodi |
| 2025-11-13 08:45:00 | Longfin Smelt | None | 1 | 57 | Juvenile | Grizzly Bay | Suisun Marsh | West | KDTR | EDSM EDI Final, USFWS Lodi |
| 2025-11-13 08:45:00 | Longfin Smelt | None | 1 | 81 | Juvenile | Grizzly Bay | Suisun Marsh | West | KDTR | EDSM EDI Final, USFWS Lodi |
| 2025-11-13 09:02:00 | Longfin Smelt | None | 1 | 82 | Juvenile | Grizzly Bay | Suisun Marsh | West | KDTR | EDSM EDI Final, USFWS Lodi |
| 2025-11-13 09:17:00 | Longfin Smelt | None | 1 | 65 | Juvenile | Grizzly Bay | Suisun Marsh | West | KDTR | EDSM EDI Final, USFWS Lodi |
| 2025-11-17 10:29:00 | Longfin Smelt | None | 1 | 60 | Juvenile | Suisun Marsh | Suisun Marsh | West | KDTR | EDSM EDI Final, USFWS Lodi |
| 2025-11-17 10:49:00 | Longfin Smelt | None | 1 | 65 | Juvenile | Suisun Marsh | Suisun Marsh | West | KDTR | EDSM EDI Final, USFWS Lodi |
| 2025-11-17 10:49:00 | Longfin Smelt | None | 1 | 81 | Juvenile | Suisun Marsh | Suisun Marsh | West | KDTR | EDSM EDI Final, USFWS Lodi |
| 2025-11-17 11:06:00 | Longfin Smelt | None | 1 | 62 | Juvenile | Suisun Marsh | Suisun Marsh | West | KDTR | EDSM EDI Final, USFWS Lodi |
| 2025-11-17 11:06:00 | Longfin Smelt | None | 1 | 67 | Juvenile | Suisun Marsh | Suisun Marsh | West | KDTR | EDSM EDI Final, USFWS Lodi |
| 2025-11-17 11:06:00 | Longfin Smelt | None | 1 | 89 | Adult | Suisun Marsh | Suisun Marsh | West | KDTR | EDSM EDI Final, USFWS Lodi |
| 2025-11-17 11:24:00 | Longfin Smelt | None | 1 | 65 | Juvenile | Suisun Marsh | Suisun Marsh | West | KDTR | EDSM EDI Final, USFWS Lodi |
| 2025-12-01 10:02:00 | Longfin Smelt | None | 1 | 62 | Juvenile | Suisun Marsh | Suisun Marsh | West | Kodiak Trawl | EDSM Provisional, USFWS Lodi |
| 2025-12-01 10:17:00 | Longfin Smelt | None | 1 | 64 | Juvenile | Suisun Marsh | Suisun Marsh | West | Kodiak Trawl | EDSM Provisional, USFWS Lodi |
| 2025-12-10 10:23:00 | Longfin Smelt | None | 1 | 58 | Juvenile | West Suisun Bay | Suisun Bay | Far West | Kodiak Trawl | EDSM Provisional, USFWS Lodi |
| 2025-12-10 10:23:00 | Longfin Smelt | None | 1 | 62 | Juvenile | West Suisun Bay | Suisun Bay | Far West | Kodiak Trawl | EDSM Provisional, USFWS Lodi |
| 2025-12-10 10:23:00 | Longfin Smelt | None | 1 | 69 | Juvenile | West Suisun Bay | Suisun Bay | Far West | Kodiak Trawl | EDSM Provisional, USFWS Lodi |
| 2025-12-10 10:23:00 | Longfin Smelt | None | 1 | 92 | Adult | West Suisun Bay | Suisun Bay | Far West | Kodiak Trawl | EDSM Provisional, USFWS Lodi |
| 2025-12-10 10:41:00 | Longfin Smelt | None | 1 | 81 | Juvenile | West Suisun Bay | Suisun Bay | Far West | Kodiak Trawl | EDSM Provisional, USFWS Lodi |
| 2025-12-10 10:41:00 | Longfin Smelt | None | 1 | 98 | Adult | West Suisun Bay | Suisun Bay | Far West | Kodiak Trawl | EDSM Provisional, USFWS Lodi |
| 2025-12-10 10:57:00 | Longfin Smelt | None | 1 | 69 | Juvenile | West Suisun Bay | Suisun Bay | Far West | Kodiak Trawl | EDSM Provisional, USFWS Lodi |
| 2025-12-10 10:57:00 | Longfin Smelt | None | 1 | 71 | Juvenile | West Suisun Bay | Suisun Bay | Far West | Kodiak Trawl | EDSM Provisional, USFWS Lodi |
| 2025-12-11 09:31:00 | Longfin Smelt | None | 1 | 60 | Juvenile | Grizzly Bay | Suisun Marsh | West | Kodiak Trawl | EDSM Provisional, USFWS Lodi |
| 2025-12-11 09:31:00 | Longfin Smelt | None | 1 | 64 | Juvenile | Grizzly Bay | Suisun Marsh | West | Kodiak Trawl | EDSM Provisional, USFWS Lodi |
| 2025-12-11 09:31:00 | Longfin Smelt | None | 1 | 69 | Juvenile | Grizzly Bay | Suisun Marsh | West | Kodiak Trawl | EDSM Provisional, USFWS Lodi |
| 2025-12-11 09:31:00 | Longfin Smelt | None | 1 | 70 | Juvenile | Grizzly Bay | Suisun Marsh | West | Kodiak Trawl | EDSM Provisional, USFWS Lodi |
| 2025-12-11 09:31:00 | Longfin Smelt | None | 1 | 76 | Juvenile | Grizzly Bay | Suisun Marsh | West | Kodiak Trawl | EDSM Provisional, USFWS Lodi |
| 2025-12-11 09:49:00 | Longfin Smelt | None | 2 | 60 | Juvenile | Grizzly Bay | Suisun Marsh | West | Kodiak Trawl | EDSM Provisional, USFWS Lodi |
| 2025-12-11 09:49:00 | Longfin Smelt | None | 1 | 61 | Juvenile | Grizzly Bay | Suisun Marsh | West | Kodiak Trawl | EDSM Provisional, USFWS Lodi |
| 2025-12-11 09:49:00 | Longfin Smelt | None | 1 | 65 | Juvenile | Grizzly Bay | Suisun Marsh | West | Kodiak Trawl | EDSM Provisional, USFWS Lodi |
| 2025-12-11 09:49:00 | Longfin Smelt | None | 1 | 72 | Juvenile | Grizzly Bay | Suisun Marsh | West | Kodiak Trawl | EDSM Provisional, USFWS Lodi |
| 2025-12-11 09:49:00 | Longfin Smelt | None | 1 | 73 | Juvenile | Grizzly Bay | Suisun Marsh | West | Kodiak Trawl | EDSM Provisional, USFWS Lodi |
| 2025-12-11 09:49:00 | Longfin Smelt | None | 1 | 94 | Adult | Grizzly Bay | Suisun Marsh | West | Kodiak Trawl | EDSM Provisional, USFWS Lodi |
| 2025-12-11 10:06:00 | Longfin Smelt | None | 1 | 69 | Juvenile | Grizzly Bay | Suisun Marsh | West | Kodiak Trawl | EDSM Provisional, USFWS Lodi |
| 2025-12-11 10:06:00 | Longfin Smelt | None | 1 | 88 | Adult | Grizzly Bay | Suisun Marsh | West | Kodiak Trawl | EDSM Provisional, USFWS Lodi |
| 2025-12-11 10:06:00 | Longfin Smelt | None | 1 | 100 | Adult | Grizzly Bay | Suisun Marsh | West | Kodiak Trawl | EDSM Provisional, USFWS Lodi |
| 2025-12-11 10:06:00 | Longfin Smelt | None | 1 | 108 | Adult | Grizzly Bay | Suisun Marsh | West | Kodiak Trawl | EDSM Provisional, USFWS Lodi |
| 2025-12-11 10:42:00 | Longfin Smelt | None | 1 | 65 | Juvenile | Suisun Marsh | Suisun Marsh | West | Kodiak Trawl | EDSM Provisional, USFWS Lodi |
| 2025-12-11 10:42:00 | Longfin Smelt | None | 1 | 100 | Adult | Suisun Marsh | Suisun Marsh | West | Kodiak Trawl | EDSM Provisional, USFWS Lodi |
| 2025-12-11 10:59:00 | Longfin Smelt | None | 1 | 63 | Juvenile | Suisun Marsh | Suisun Marsh | West | Kodiak Trawl | EDSM Provisional, USFWS Lodi |
| 2025-12-11 10:59:00 | Longfin Smelt | None | 1 | 66 | Juvenile | Suisun Marsh | Suisun Marsh | West | Kodiak Trawl | EDSM Provisional, USFWS Lodi |
| 2025-12-11 10:59:00 | Longfin Smelt | None | 1 | 72 | Juvenile | Suisun Marsh | Suisun Marsh | West | Kodiak Trawl | EDSM Provisional, USFWS Lodi |
| 2025-12-11 10:59:00 | Longfin Smelt | None | 1 | 74 | Juvenile | Suisun Marsh | Suisun Marsh | West | Kodiak Trawl | EDSM Provisional, USFWS Lodi |
| 2025-12-11 10:59:00 | Longfin Smelt | None | 2 | 78 | Juvenile | Suisun Marsh | Suisun Marsh | West | Kodiak Trawl | EDSM Provisional, USFWS Lodi |
| 2025-12-11 10:59:00 | Longfin Smelt | None | 1 | 97 | Adult | Suisun Marsh | Suisun Marsh | West | Kodiak Trawl | EDSM Provisional, USFWS Lodi |
| 2025-12-11 10:59:00 | Longfin Smelt | None | 1 | 98 | Adult | Suisun Marsh | Suisun Marsh | West | Kodiak Trawl | EDSM Provisional, USFWS Lodi |
| 2025-12-11 10:59:00 | Longfin Smelt | None | 1 | 103 | Adult | Suisun Marsh | Suisun Marsh | West | Kodiak Trawl | EDSM Provisional, USFWS Lodi |
| 2025-12-11 11:38:00 | Longfin Smelt | None | 1 | 76 | Juvenile | Suisun Marsh | Suisun Marsh | West | Kodiak Trawl | EDSM Provisional, USFWS Lodi |
| 2025-12-11 11:54:00 | Longfin Smelt | None | 1 | 64 | Juvenile | Suisun Marsh | Suisun Marsh | West | Kodiak Trawl | EDSM Provisional, USFWS Lodi |
| 2025-12-11 11:54:00 | Longfin Smelt | None | 1 | 69 | Juvenile | Suisun Marsh | Suisun Marsh | West | Kodiak Trawl | EDSM Provisional, USFWS Lodi |
| 2025-12-11 11:54:00 | Longfin Smelt | None | 1 | 109 | Adult | Suisun Marsh | Suisun Marsh | West | Kodiak Trawl | EDSM Provisional, USFWS Lodi |
| 2025-12-11 12:26:00 | Longfin Smelt | None | 1 | 62 | Juvenile | Suisun Marsh | Suisun Marsh | West | Kodiak Trawl | EDSM Provisional, USFWS Lodi |
| 2025-12-15 09:04:00 | Longfin Smelt | None | 1 | 77 | Juvenile | Mid Suisun Bay | Suisun Bay | West | Kodiak Trawl | EDSM Provisional, USFWS Lodi |
| 2025-12-15 09:04:00 | Longfin Smelt | None | 1 | 79 | Juvenile | Mid Suisun Bay | Suisun Bay | West | Kodiak Trawl | EDSM Provisional, USFWS Lodi |
| 2025-12-15 09:04:00 | Longfin Smelt | None | 1 | 114 | Adult | Mid Suisun Bay | Suisun Bay | West | Kodiak Trawl | EDSM Provisional, USFWS Lodi |
| 2025-12-15 09:53:00 | Longfin Smelt | None | 1 | 97 | Adult | Mid Suisun Bay | Suisun Bay | West | EDSM Provisional, USFWS Lodi | |
| 2025-12-17 08:25:00 | Longfin Smelt | None | 1 | 75 | Juvenile | Suisun Marsh | Suisun Marsh | West | Kodiak Trawl | EDSM Provisional, USFWS Lodi |
| 2025-12-17 08:40:00 | Longfin Smelt | None | 1 | 75 | Juvenile | Suisun Marsh | Suisun Marsh | West | Kodiak Trawl | EDSM Provisional, USFWS Lodi |
| 2025-12-17 08:40:00 | Longfin Smelt | None | 1 | 84 | Juvenile | Suisun Marsh | Suisun Marsh | West | Kodiak Trawl | EDSM Provisional, USFWS Lodi |
| 2025-12-17 09:32:00 | Longfin Smelt | None | 1 | 70 | Juvenile | Grizzly Bay | Suisun Marsh | West | Kodiak Trawl | EDSM Provisional, USFWS Lodi |
| 2025-12-17 09:32:00 | Longfin Smelt | None | 1 | 73 | Juvenile | Grizzly Bay | Suisun Marsh | West | Kodiak Trawl | EDSM Provisional, USFWS Lodi |
| 2025-12-17 09:32:00 | Longfin Smelt | None | 1 | 75 | Juvenile | Grizzly Bay | Suisun Marsh | West | Kodiak Trawl | EDSM Provisional, USFWS Lodi |
| 2025-12-17 09:48:00 | Longfin Smelt | None | 1 | 64 | Juvenile | Grizzly Bay | Suisun Marsh | West | Kodiak Trawl | EDSM Provisional, USFWS Lodi |
| 2025-12-17 09:48:00 | Longfin Smelt | None | 1 | 98 | Adult | Grizzly Bay | Suisun Marsh | West | Kodiak Trawl | EDSM Provisional, USFWS Lodi |
| 2025-12-17 10:03:00 | Longfin Smelt | None | 1 | 69 | Juvenile | Grizzly Bay | Suisun Marsh | West | Kodiak Trawl | EDSM Provisional, USFWS Lodi |
| 2025-12-17 10:18:00 | Longfin Smelt | None | 1 | 78 | Juvenile | Grizzly Bay | Suisun Marsh | West | Kodiak Trawl | EDSM Provisional, USFWS Lodi |
| 2025-12-29 08:44:00 | Longfin Smelt | None | 1 | 79 | Juvenile | Grizzly Bay | Suisun Marsh | West | Kodiak Trawl | EDSM Provisional, USFWS Lodi |
| 2025-12-29 08:44:00 | Longfin Smelt | None | 1 | 101 | Adult | Grizzly Bay | Suisun Marsh | West | Kodiak Trawl | EDSM Provisional, USFWS Lodi |
| 2025-12-29 09:01:00 | Longfin Smelt | None | 1 | 103 | Adult | Grizzly Bay | Suisun Marsh | West | Kodiak Trawl | EDSM Provisional, USFWS Lodi |
| 2025-12-29 09:44:00 | Longfin Smelt | None | 1 | 60 | Juvenile | Suisun Marsh | Suisun Marsh | West | Kodiak Trawl | EDSM Provisional, USFWS Lodi |
| 2025-12-29 10:14:00 | Longfin Smelt | None | 1 | 75 | Juvenile | Suisun Marsh | Suisun Marsh | West | Kodiak Trawl | EDSM Provisional, USFWS Lodi |
| 2025-12-30 09:49:00 | Longfin Smelt | None | 1 | 90 | Adult | Confluence | Suisun Bay | West | Kodiak Trawl | EDSM Provisional, USFWS Lodi |
| 2025-12-30 10:19:00 | Longfin Smelt | None | 1 | 75 | Juvenile | Confluence | Suisun Bay | West | Kodiak Trawl | EDSM Provisional, USFWS Lodi |
| 2025-12-30 10:19:00 | Longfin Smelt | None | 1 | 102 | Adult | Confluence | Suisun Bay | West | Kodiak Trawl | EDSM Provisional, USFWS Lodi |
| 2025-12-31 09:27:00 | Longfin Smelt | None | 1 | 51 | Juvenile | West Suisun Bay | Suisun Bay | Far West | Kodiak Trawl | EDSM Provisional, USFWS Lodi |
| 2025-12-31 09:27:00 | Longfin Smelt | None | 1 | 115 | Adult | West Suisun Bay | Suisun Bay | Far West | Kodiak Trawl | EDSM Provisional, USFWS Lodi |
| 2025-12-31 11:05:00 | Longfin Smelt | None | 1 | 90 | Adult | West Suisun Bay | Suisun Bay | Far West | Kodiak Trawl | EDSM Provisional, USFWS Lodi |
| 2026-01-05 09:15:00 | Longfin Smelt | None | 1 | 104 | Adult | West Suisun Bay | Suisun Bay | Far West | Kodiak Trawl | EDSM Provisional, USFWS Lodi |
| 2026-01-05 09:30:00 | Longfin Smelt | None | 1 | 97 | Adult | West Suisun Bay | Suisun Bay | Far West | Kodiak Trawl | EDSM Provisional, USFWS Lodi |
| 2026-01-05 10:34:00 | Longfin Smelt | None | 1 | 69 | Juvenile | West Suisun Bay | Suisun Bay | Far West | Kodiak Trawl | EDSM Provisional, USFWS Lodi |
| 2026-01-05 11:19:00 | Longfin Smelt | None | 1 | 81 | Juvenile | West Suisun Bay | Suisun Bay | Far West | Kodiak Trawl | EDSM Provisional, USFWS Lodi |
| 2026-01-06 09:23:00 | Longfin Smelt | None | 1 | 84 | Juvenile | Honker Bay | Suisun Bay | West | Kodiak Trawl | EDSM Provisional, USFWS Lodi |
| 2026-01-07 10:28:00 | Longfin Smelt | None | 1 | 79 | Juvenile | Suisun Marsh | Suisun Marsh | West | Kodiak Trawl | EDSM Provisional, USFWS Lodi |
| 2026-01-12 08:25:00 | Longfin Smelt | None | 1 | 103 | Adult | Lower Sacramento River | Lower Sacramento | West | Kodiak Trawl | EDSM Provisional, USFWS Lodi |
| 2026-01-12 08:41:00 | Longfin Smelt | None | 1 | 79 | Juvenile | Lower Sacramento River | Lower Sacramento | West | Kodiak Trawl | EDSM Provisional, USFWS Lodi |
| 2026-01-12 08:41:00 | Longfin Smelt | None | 1 | 90 | Adult | Lower Sacramento River | Lower Sacramento | West | Kodiak Trawl | EDSM Provisional, USFWS Lodi |
| 2026-01-12 08:41:00 | Longfin Smelt | None | 1 | 99 | Adult | Lower Sacramento River | Lower Sacramento | West | Kodiak Trawl | EDSM Provisional, USFWS Lodi |
| 2026-01-12 08:41:00 | Longfin Smelt | None | 1 | 106 | Adult | Lower Sacramento River | Lower Sacramento | West | Kodiak Trawl | EDSM Provisional, USFWS Lodi |
| 2026-01-12 08:41:00 | Longfin Smelt | None | 2 | 108 | Adult | Lower Sacramento River | Lower Sacramento | West | Kodiak Trawl | EDSM Provisional, USFWS Lodi |
| 2026-01-12 08:58:00 | Longfin Smelt | None | 1 | 57 | Juvenile | Lower Sacramento River | Lower Sacramento | West | Kodiak Trawl | EDSM Provisional, USFWS Lodi |
| 2026-01-12 08:58:00 | Longfin Smelt | None | 1 | 90 | Adult | Lower Sacramento River | Lower Sacramento | West | Kodiak Trawl | EDSM Provisional, USFWS Lodi |
| 2026-01-12 08:58:00 | Longfin Smelt | None | 1 | 91 | Adult | Lower Sacramento River | Lower Sacramento | West | Kodiak Trawl | EDSM Provisional, USFWS Lodi |
| 2026-01-12 08:58:00 | Longfin Smelt | None | 1 | 94 | Adult | Lower Sacramento River | Lower Sacramento | West | Kodiak Trawl | EDSM Provisional, USFWS Lodi |
| 2026-01-12 08:58:00 | Longfin Smelt | None | 2 | 95 | Adult | Lower Sacramento River | Lower Sacramento | West | Kodiak Trawl | EDSM Provisional, USFWS Lodi |
| 2026-01-12 08:58:00 | Longfin Smelt | None | 1 | 103 | Adult | Lower Sacramento River | Lower Sacramento | West | Kodiak Trawl | EDSM Provisional, USFWS Lodi |
| 2026-01-12 08:58:00 | Longfin Smelt | None | 2 | 106 | Adult | Lower Sacramento River | Lower Sacramento | West | Kodiak Trawl | EDSM Provisional, USFWS Lodi |
| 2026-01-12 09:16:00 | Longfin Smelt | None | 1 | 101 | Adult | Lower Sacramento River | Lower Sacramento | West | EDSM Provisional, USFWS Lodi | |
| 2026-01-12 09:38:00 | Longfin Smelt | None | 1 | 80 | Juvenile | Lower Sacramento River | Lower Sacramento | West | Kodiak Trawl | EDSM Provisional, USFWS Lodi |
| 2026-01-12 09:38:00 | Longfin Smelt | None | 1 | 88 | Adult | Lower Sacramento River | Lower Sacramento | West | Kodiak Trawl | EDSM Provisional, USFWS Lodi |
| 2026-01-12 10:21:00 | Longfin Smelt | None | 1 | 74 | Juvenile | Lower Sacramento River | Lower Sacramento | West | Kodiak Trawl | EDSM Provisional, USFWS Lodi |
| 2026-01-12 10:21:00 | Longfin Smelt | None | 1 | 76 | Juvenile | Lower Sacramento River | Lower Sacramento | West | Kodiak Trawl | EDSM Provisional, USFWS Lodi |
| 2026-01-12 10:21:00 | Longfin Smelt | None | 1 | 86 | Adult | Lower Sacramento River | Lower Sacramento | West | Kodiak Trawl | EDSM Provisional, USFWS Lodi |
| 2026-01-12 10:39:00 | Longfin Smelt | None | 1 | 105 | Adult | Lower Sacramento River | Lower Sacramento | West | EDSM Provisional, USFWS Lodi | |
| 2026-01-12 10:39:00 | Longfin Smelt | None | 1 | 109 | Adult | Lower Sacramento River | Lower Sacramento | West | EDSM Provisional, USFWS Lodi | |
| 2026-01-12 11:10:00 | Longfin Smelt | None | 1 | 73 | Juvenile | Sacramento River near Rio Vista | Lower Sacramento | North | EDSM Provisional, USFWS Lodi | |
| 2026-01-13 12:48:00 | Longfin Smelt | None | 1 | 76 | Juvenile | East San Pablo Bay | Western Delta | Far West | Kodiak Trawl | EDSM Provisional, USFWS Lodi |
| 2026-01-13 12:48:00 | Longfin Smelt | None | 1 | 83 | Juvenile | East San Pablo Bay | Western Delta | Far West | Kodiak Trawl | EDSM Provisional, USFWS Lodi |
| 2026-01-20 08:25:00 | Longfin Smelt | None | 1 | 76 | Juvenile | West Suisun Bay | Suisun Bay | Far West | Kodiak Trawl | EDSM Provisional, USFWS Lodi |
| 2026-01-20 08:39:00 | Longfin Smelt | None | 1 | 62 | Juvenile | West Suisun Bay | Suisun Bay | Far West | Kodiak Trawl | EDSM Provisional, USFWS Lodi |
| 2026-01-20 08:39:00 | Longfin Smelt | None | 1 | 67 | Juvenile | West Suisun Bay | Suisun Bay | Far West | Kodiak Trawl | EDSM Provisional, USFWS Lodi |
| 2026-01-20 08:39:00 | Longfin Smelt | None | 1 | 76 | Juvenile | West Suisun Bay | Suisun Bay | Far West | Kodiak Trawl | EDSM Provisional, USFWS Lodi |
| 2026-01-20 08:49:00 | Longfin Smelt | None | 1 | 85 | Adult | Lower Sacramento River | Lower Sacramento | West | Kodiak Trawl | EDSM Provisional, USFWS Lodi |
| 2026-01-20 08:53:00 | Longfin Smelt | None | 1 | 58 | Juvenile | West Suisun Bay | Suisun Bay | Far West | Kodiak Trawl | EDSM Provisional, USFWS Lodi |
| 2026-01-20 08:53:00 | Longfin Smelt | None | 1 | 65 | Juvenile | West Suisun Bay | Suisun Bay | Far West | Kodiak Trawl | EDSM Provisional, USFWS Lodi |
| 2026-01-20 08:53:00 | Longfin Smelt | None | 1 | 81 | Juvenile | West Suisun Bay | Suisun Bay | Far West | Kodiak Trawl | EDSM Provisional, USFWS Lodi |
| 2026-01-20 08:53:00 | Longfin Smelt | None | 1 | 82 | Juvenile | West Suisun Bay | Suisun Bay | Far West | Kodiak Trawl | EDSM Provisional, USFWS Lodi |
| 2026-01-20 09:08:00 | Longfin Smelt | None | 2 | 74 | Juvenile | West Suisun Bay | Suisun Bay | Far West | Kodiak Trawl | EDSM Provisional, USFWS Lodi |
| 2026-01-20 09:08:00 | Longfin Smelt | None | 2 | 76 | Juvenile | West Suisun Bay | Suisun Bay | Far West | Kodiak Trawl | EDSM Provisional, USFWS Lodi |
| 2026-01-20 10:20:00 | Longfin Smelt | None | 1 | 81 | Juvenile | West Suisun Bay | Suisun Bay | Far West | Kodiak Trawl | EDSM Provisional, USFWS Lodi |
| 2026-01-20 10:51:00 | Longfin Smelt | None | 1 | 73 | Juvenile | West Suisun Bay | Suisun Bay | Far West | Kodiak Trawl | EDSM Provisional, USFWS Lodi |
| 2026-01-20 10:51:00 | Longfin Smelt | None | 2 | 74 | Juvenile | West Suisun Bay | Suisun Bay | Far West | Kodiak Trawl | EDSM Provisional, USFWS Lodi |
| 2026-01-20 10:51:00 | Longfin Smelt | None | 1 | 90 | Adult | West Suisun Bay | Suisun Bay | Far West | Kodiak Trawl | EDSM Provisional, USFWS Lodi |
| 2026-01-20 10:51:00 | Longfin Smelt | None | 1 | 101 | Adult | West Suisun Bay | Suisun Bay | Far West | Kodiak Trawl | EDSM Provisional, USFWS Lodi |
| 2026-01-20 11:25:00 | Longfin Smelt | None | 1 | 66 | Juvenile | West Suisun Bay | Suisun Bay | Far West | Kodiak Trawl | EDSM Provisional, USFWS Lodi |
| 2026-01-20 11:25:00 | Longfin Smelt | None | 1 | 72 | Juvenile | West Suisun Bay | Suisun Bay | Far West | Kodiak Trawl | EDSM Provisional, USFWS Lodi |
| 2026-01-20 11:25:00 | Longfin Smelt | None | 2 | 75 | Juvenile | West Suisun Bay | Suisun Bay | Far West | Kodiak Trawl | EDSM Provisional, USFWS Lodi |
| 2026-01-20 11:25:00 | Longfin Smelt | None | 2 | 78 | Juvenile | West Suisun Bay | Suisun Bay | Far West | Kodiak Trawl | EDSM Provisional, USFWS Lodi |
| 2026-01-20 11:25:00 | Longfin Smelt | None | 1 | NA | West Suisun Bay | Suisun Bay | Far West | Kodiak Trawl | EDSM Provisional, USFWS Lodi | |
| 2026-01-20 11:42:00 | Longfin Smelt | None | 1 | 66 | Juvenile | West Suisun Bay | Suisun Bay | Far West | Kodiak Trawl | EDSM Provisional, USFWS Lodi |
| 2026-01-20 11:42:00 | Longfin Smelt | None | 1 | 68 | Juvenile | West Suisun Bay | Suisun Bay | Far West | Kodiak Trawl | EDSM Provisional, USFWS Lodi |
| 2026-01-20 11:42:00 | Longfin Smelt | None | 1 | 70 | Juvenile | West Suisun Bay | Suisun Bay | Far West | Kodiak Trawl | EDSM Provisional, USFWS Lodi |
| 2026-01-20 11:42:00 | Longfin Smelt | None | 3 | 74 | Juvenile | West Suisun Bay | Suisun Bay | Far West | Kodiak Trawl | EDSM Provisional, USFWS Lodi |
| 2026-01-20 11:42:00 | Longfin Smelt | None | 1 | 80 | Juvenile | West Suisun Bay | Suisun Bay | Far West | Kodiak Trawl | EDSM Provisional, USFWS Lodi |
| 2026-01-20 11:42:00 | Longfin Smelt | None | 2 | 89 | Adult | West Suisun Bay | Suisun Bay | Far West | Kodiak Trawl | EDSM Provisional, USFWS Lodi |
| 2026-01-22 08:38:00 | Longfin Smelt | None | 1 | 77 | Juvenile | East San Pablo Bay | Western Delta | Far West | Kodiak Trawl | EDSM Provisional, USFWS Lodi |
| 2026-01-26 10:59:00 | Longfin Smelt | None | 1 | 71 | Juvenile | West Suisun Bay | Suisun Bay | Far West | Kodiak Trawl | EDSM Provisional, USFWS Lodi |
| 2026-01-26 10:59:00 | Longfin Smelt | None | 1 | 77 | Juvenile | West Suisun Bay | Suisun Bay | Far West | Kodiak Trawl | EDSM Provisional, USFWS Lodi |
| 2026-01-26 10:59:00 | Longfin Smelt | None | 1 | 87 | Adult | West Suisun Bay | Suisun Bay | Far West | Kodiak Trawl | EDSM Provisional, USFWS Lodi |
| 2026-01-26 10:59:00 | Longfin Smelt | None | 1 | 104 | Adult | West Suisun Bay | Suisun Bay | Far West | Kodiak Trawl | EDSM Provisional, USFWS Lodi |
| 2026-01-26 11:15:00 | Longfin Smelt | None | 1 | 66 | Juvenile | West Suisun Bay | Suisun Bay | Far West | Kodiak Trawl | EDSM Provisional, USFWS Lodi |
| 2026-01-26 11:15:00 | Longfin Smelt | None | 1 | 67 | Juvenile | West Suisun Bay | Suisun Bay | Far West | Kodiak Trawl | EDSM Provisional, USFWS Lodi |
| 2026-01-26 11:15:00 | Longfin Smelt | None | 1 | 78 | Juvenile | West Suisun Bay | Suisun Bay | Far West | Kodiak Trawl | EDSM Provisional, USFWS Lodi |
| 2026-01-26 11:15:00 | Longfin Smelt | None | 1 | 79 | Juvenile | West Suisun Bay | Suisun Bay | Far West | Kodiak Trawl | EDSM Provisional, USFWS Lodi |
| 2026-01-26 11:15:00 | Longfin Smelt | None | 1 | 81 | Juvenile | West Suisun Bay | Suisun Bay | Far West | Kodiak Trawl | EDSM Provisional, USFWS Lodi |
| 2026-01-26 11:15:00 | Longfin Smelt | None | 1 | 82 | Juvenile | West Suisun Bay | Suisun Bay | Far West | Kodiak Trawl | EDSM Provisional, USFWS Lodi |
| 2026-01-26 11:15:00 | Longfin Smelt | None | 1 | 83 | Juvenile | West Suisun Bay | Suisun Bay | Far West | Kodiak Trawl | EDSM Provisional, USFWS Lodi |
| 2026-01-26 11:15:00 | Longfin Smelt | None | 1 | 89 | Adult | West Suisun Bay | Suisun Bay | Far West | Kodiak Trawl | EDSM Provisional, USFWS Lodi |
| 2026-01-26 11:15:00 | Longfin Smelt | None | 1 | 105 | Adult | West Suisun Bay | Suisun Bay | Far West | Kodiak Trawl | EDSM Provisional, USFWS Lodi |
| 2026-01-26 11:56:00 | Longfin Smelt | None | 1 | 77 | Juvenile | West Suisun Bay | Suisun Bay | Far West | Kodiak Trawl | EDSM Provisional, USFWS Lodi |
| 2026-01-26 11:56:00 | Longfin Smelt | None | 1 | 83 | Juvenile | West Suisun Bay | Suisun Bay | Far West | Kodiak Trawl | EDSM Provisional, USFWS Lodi |
| 2026-01-27 09:43:00 | Longfin Smelt | None | 1 | 71 | Juvenile | Grizzly Bay | Suisun Marsh | West | Kodiak Trawl | EDSM Provisional, USFWS Lodi |
| 2026-01-27 09:43:00 | Longfin Smelt | None | 1 | 72 | Juvenile | Grizzly Bay | Suisun Marsh | West | Kodiak Trawl | EDSM Provisional, USFWS Lodi |
| 2026-01-27 09:58:00 | Longfin Smelt | None | 1 | 74 | Juvenile | Grizzly Bay | Suisun Marsh | West | Kodiak Trawl | EDSM Provisional, USFWS Lodi |
| 2026-01-27 09:58:00 | Longfin Smelt | None | 1 | 75 | Juvenile | Grizzly Bay | Suisun Marsh | West | Kodiak Trawl | EDSM Provisional, USFWS Lodi |
| 2026-01-27 09:58:00 | Longfin Smelt | None | 1 | 78 | Juvenile | Grizzly Bay | Suisun Marsh | West | Kodiak Trawl | EDSM Provisional, USFWS Lodi |
| 2026-01-27 09:58:00 | Longfin Smelt | None | 1 | 80 | Juvenile | Grizzly Bay | Suisun Marsh | West | Kodiak Trawl | EDSM Provisional, USFWS Lodi |
| 2026-01-27 09:58:00 | Longfin Smelt | None | 1 | 82 | Juvenile | Grizzly Bay | Suisun Marsh | West | Kodiak Trawl | EDSM Provisional, USFWS Lodi |
| 2026-01-27 09:58:00 | Longfin Smelt | None | 1 | 84 | Juvenile | Grizzly Bay | Suisun Marsh | West | Kodiak Trawl | EDSM Provisional, USFWS Lodi |
| 2026-01-27 09:58:00 | Longfin Smelt | None | 1 | 86 | Adult | Grizzly Bay | Suisun Marsh | West | Kodiak Trawl | EDSM Provisional, USFWS Lodi |
| 2026-01-27 09:58:00 | Longfin Smelt | None | 2 | 90 | Adult | Grizzly Bay | Suisun Marsh | West | Kodiak Trawl | EDSM Provisional, USFWS Lodi |
| 2026-01-27 09:58:00 | Longfin Smelt | None | 1 | 94 | Adult | Grizzly Bay | Suisun Marsh | West | Kodiak Trawl | EDSM Provisional, USFWS Lodi |
| 2026-01-27 09:58:00 | Longfin Smelt | None | 2 | 96 | Adult | Grizzly Bay | Suisun Marsh | West | Kodiak Trawl | EDSM Provisional, USFWS Lodi |
| 2026-01-27 09:58:00 | Longfin Smelt | None | 1 | 97 | Adult | Grizzly Bay | Suisun Marsh | West | Kodiak Trawl | EDSM Provisional, USFWS Lodi |
| 2026-01-27 09:58:00 | Longfin Smelt | None | 1 | 99 | Adult | Grizzly Bay | Suisun Marsh | West | Kodiak Trawl | EDSM Provisional, USFWS Lodi |
| 2026-01-27 09:58:00 | Longfin Smelt | None | 1 | 100 | Adult | Grizzly Bay | Suisun Marsh | West | Kodiak Trawl | EDSM Provisional, USFWS Lodi |
| 2026-01-27 10:22:00 | Longfin Smelt | None | 2 | 60 | Juvenile | Grizzly Bay | Suisun Marsh | West | Kodiak Trawl | EDSM Provisional, USFWS Lodi |
| 2026-01-27 10:22:00 | Longfin Smelt | None | 1 | 64 | Juvenile | Grizzly Bay | Suisun Marsh | West | Kodiak Trawl | EDSM Provisional, USFWS Lodi |
| 2026-01-27 10:22:00 | Longfin Smelt | None | 3 | 65 | Juvenile | Grizzly Bay | Suisun Marsh | West | Kodiak Trawl | EDSM Provisional, USFWS Lodi |
| 2026-01-27 10:22:00 | Longfin Smelt | None | 2 | 66 | Juvenile | Grizzly Bay | Suisun Marsh | West | Kodiak Trawl | EDSM Provisional, USFWS Lodi |
| 2026-01-27 10:22:00 | Longfin Smelt | None | 1 | 67 | Juvenile | Grizzly Bay | Suisun Marsh | West | Kodiak Trawl | EDSM Provisional, USFWS Lodi |
| 2026-01-27 10:22:00 | Longfin Smelt | None | 4 | 72 | Juvenile | Grizzly Bay | Suisun Marsh | West | Kodiak Trawl | EDSM Provisional, USFWS Lodi |
| 2026-01-27 10:22:00 | Longfin Smelt | None | 2 | 73 | Juvenile | Grizzly Bay | Suisun Marsh | West | Kodiak Trawl | EDSM Provisional, USFWS Lodi |
| 2026-01-27 10:22:00 | Longfin Smelt | None | 2 | 74 | Juvenile | Grizzly Bay | Suisun Marsh | West | Kodiak Trawl | EDSM Provisional, USFWS Lodi |
| 2026-01-27 10:22:00 | Longfin Smelt | None | 1 | 75 | Juvenile | Grizzly Bay | Suisun Marsh | West | Kodiak Trawl | EDSM Provisional, USFWS Lodi |
| 2026-01-27 10:22:00 | Longfin Smelt | None | 3 | 76 | Juvenile | Grizzly Bay | Suisun Marsh | West | Kodiak Trawl | EDSM Provisional, USFWS Lodi |
| 2026-01-27 10:22:00 | Longfin Smelt | None | 2 | 77 | Juvenile | Grizzly Bay | Suisun Marsh | West | Kodiak Trawl | EDSM Provisional, USFWS Lodi |
| 2026-01-27 10:22:00 | Longfin Smelt | None | 3 | 78 | Juvenile | Grizzly Bay | Suisun Marsh | West | Kodiak Trawl | EDSM Provisional, USFWS Lodi |
| 2026-01-27 10:22:00 | Longfin Smelt | None | 1 | 79 | Juvenile | Grizzly Bay | Suisun Marsh | West | Kodiak Trawl | EDSM Provisional, USFWS Lodi |
| 2026-01-27 10:22:00 | Longfin Smelt | None | 5 | 80 | Juvenile | Grizzly Bay | Suisun Marsh | West | Kodiak Trawl | EDSM Provisional, USFWS Lodi |
| 2026-01-27 10:22:00 | Longfin Smelt | None | 3 | 82 | Juvenile | Grizzly Bay | Suisun Marsh | West | Kodiak Trawl | EDSM Provisional, USFWS Lodi |
| 2026-01-27 10:22:00 | Longfin Smelt | None | 2 | 83 | Juvenile | Grizzly Bay | Suisun Marsh | West | Kodiak Trawl | EDSM Provisional, USFWS Lodi |
| 2026-01-27 10:22:00 | Longfin Smelt | None | 1 | 84 | Juvenile | Grizzly Bay | Suisun Marsh | West | Kodiak Trawl | EDSM Provisional, USFWS Lodi |
| 2026-01-27 10:22:00 | Longfin Smelt | None | 2 | 85 | Adult | Grizzly Bay | Suisun Marsh | West | Kodiak Trawl | EDSM Provisional, USFWS Lodi |
| 2026-01-27 10:22:00 | Longfin Smelt | None | 5 | 86 | Adult | Grizzly Bay | Suisun Marsh | West | Kodiak Trawl | EDSM Provisional, USFWS Lodi |
| 2026-01-27 10:22:00 | Longfin Smelt | None | 2 | 88 | Adult | Grizzly Bay | Suisun Marsh | West | Kodiak Trawl | EDSM Provisional, USFWS Lodi |
| 2026-01-27 10:22:00 | Longfin Smelt | None | 1 | 95 | Adult | Grizzly Bay | Suisun Marsh | West | Kodiak Trawl | EDSM Provisional, USFWS Lodi |
| 2026-01-27 10:22:00 | Longfin Smelt | None | 1 | 97 | Adult | Grizzly Bay | Suisun Marsh | West | Kodiak Trawl | EDSM Provisional, USFWS Lodi |
| 2026-01-27 10:22:00 | Longfin Smelt | None | 1 | 98 | Adult | Grizzly Bay | Suisun Marsh | West | Kodiak Trawl | EDSM Provisional, USFWS Lodi |
| 2026-01-27 10:22:00 | Longfin Smelt | None | 2 | NA | Grizzly Bay | Suisun Marsh | West | Kodiak Trawl | EDSM Provisional, USFWS Lodi | |
| 2026-01-27 10:38:00 | Longfin Smelt | None | 1 | 58 | Juvenile | Grizzly Bay | Suisun Marsh | West | Kodiak Trawl | EDSM Provisional, USFWS Lodi |
| 2026-01-27 10:38:00 | Longfin Smelt | None | 1 | 59 | Juvenile | Grizzly Bay | Suisun Marsh | West | Kodiak Trawl | EDSM Provisional, USFWS Lodi |
| 2026-01-27 10:38:00 | Longfin Smelt | None | 1 | 60 | Juvenile | Grizzly Bay | Suisun Marsh | West | Kodiak Trawl | EDSM Provisional, USFWS Lodi |
| 2026-01-27 10:38:00 | Longfin Smelt | None | 1 | 62 | Juvenile | Grizzly Bay | Suisun Marsh | West | Kodiak Trawl | EDSM Provisional, USFWS Lodi |
| 2026-01-27 10:38:00 | Longfin Smelt | None | 1 | 66 | Juvenile | Grizzly Bay | Suisun Marsh | West | Kodiak Trawl | EDSM Provisional, USFWS Lodi |
| 2026-01-27 10:38:00 | Longfin Smelt | None | 1 | 67 | Juvenile | Grizzly Bay | Suisun Marsh | West | Kodiak Trawl | EDSM Provisional, USFWS Lodi |
| 2026-01-27 10:38:00 | Longfin Smelt | None | 1 | 68 | Juvenile | Grizzly Bay | Suisun Marsh | West | Kodiak Trawl | EDSM Provisional, USFWS Lodi |
| 2026-01-27 10:38:00 | Longfin Smelt | None | 1 | 70 | Juvenile | Grizzly Bay | Suisun Marsh | West | Kodiak Trawl | EDSM Provisional, USFWS Lodi |
| 2026-01-27 10:38:00 | Longfin Smelt | None | 1 | 71 | Juvenile | Grizzly Bay | Suisun Marsh | West | Kodiak Trawl | EDSM Provisional, USFWS Lodi |
| 2026-01-27 10:38:00 | Longfin Smelt | None | 4 | 72 | Juvenile | Grizzly Bay | Suisun Marsh | West | Kodiak Trawl | EDSM Provisional, USFWS Lodi |
| 2026-01-27 10:38:00 | Longfin Smelt | None | 1 | 73 | Juvenile | Grizzly Bay | Suisun Marsh | West | Kodiak Trawl | EDSM Provisional, USFWS Lodi |
| 2026-01-27 10:38:00 | Longfin Smelt | None | 2 | 74 | Juvenile | Grizzly Bay | Suisun Marsh | West | Kodiak Trawl | EDSM Provisional, USFWS Lodi |
| 2026-01-27 10:38:00 | Longfin Smelt | None | 2 | 75 | Juvenile | Grizzly Bay | Suisun Marsh | West | Kodiak Trawl | EDSM Provisional, USFWS Lodi |
| 2026-01-27 10:38:00 | Longfin Smelt | None | 2 | 76 | Juvenile | Grizzly Bay | Suisun Marsh | West | Kodiak Trawl | EDSM Provisional, USFWS Lodi |
| 2026-01-27 10:38:00 | Longfin Smelt | None | 3 | 77 | Juvenile | Grizzly Bay | Suisun Marsh | West | Kodiak Trawl | EDSM Provisional, USFWS Lodi |
| 2026-01-27 10:38:00 | Longfin Smelt | None | 3 | 78 | Juvenile | Grizzly Bay | Suisun Marsh | West | Kodiak Trawl | EDSM Provisional, USFWS Lodi |
| 2026-01-27 10:38:00 | Longfin Smelt | None | 1 | 79 | Juvenile | Grizzly Bay | Suisun Marsh | West | Kodiak Trawl | EDSM Provisional, USFWS Lodi |
| 2026-01-27 10:38:00 | Longfin Smelt | None | 3 | 80 | Juvenile | Grizzly Bay | Suisun Marsh | West | Kodiak Trawl | EDSM Provisional, USFWS Lodi |
| 2026-01-27 10:38:00 | Longfin Smelt | None | 3 | 81 | Juvenile | Grizzly Bay | Suisun Marsh | West | Kodiak Trawl | EDSM Provisional, USFWS Lodi |
| 2026-01-27 10:38:00 | Longfin Smelt | None | 1 | 82 | Juvenile | Grizzly Bay | Suisun Marsh | West | Kodiak Trawl | EDSM Provisional, USFWS Lodi |
| 2026-01-27 10:38:00 | Longfin Smelt | None | 1 | 84 | Juvenile | Grizzly Bay | Suisun Marsh | West | Kodiak Trawl | EDSM Provisional, USFWS Lodi |
| 2026-01-27 10:38:00 | Longfin Smelt | None | 1 | 90 | Adult | Grizzly Bay | Suisun Marsh | West | Kodiak Trawl | EDSM Provisional, USFWS Lodi |
| 2026-01-27 10:38:00 | Longfin Smelt | None | 1 | 91 | Adult | Grizzly Bay | Suisun Marsh | West | Kodiak Trawl | EDSM Provisional, USFWS Lodi |
| 2026-01-27 10:38:00 | Longfin Smelt | None | 1 | 92 | Adult | Grizzly Bay | Suisun Marsh | West | Kodiak Trawl | EDSM Provisional, USFWS Lodi |
| 2026-01-27 10:38:00 | Longfin Smelt | None | 1 | 95 | Adult | Grizzly Bay | Suisun Marsh | West | Kodiak Trawl | EDSM Provisional, USFWS Lodi |
| 2026-01-27 10:38:00 | Longfin Smelt | None | 1 | 103 | Adult | Grizzly Bay | Suisun Marsh | West | Kodiak Trawl | EDSM Provisional, USFWS Lodi |
| 2026-01-27 10:38:00 | Longfin Smelt | None | 1 | 107 | Adult | Grizzly Bay | Suisun Marsh | West | Kodiak Trawl | EDSM Provisional, USFWS Lodi |
| 2026-01-27 10:56:00 | Longfin Smelt | None | 1 | 75 | Juvenile | Grizzly Bay | Suisun Marsh | West | EDSM Provisional, USFWS Lodi | |
| 2026-01-27 10:56:00 | Longfin Smelt | None | 1 | 87 | Adult | Grizzly Bay | Suisun Marsh | West | EDSM Provisional, USFWS Lodi | |
| 2026-01-27 10:56:00 | Longfin Smelt | None | 1 | 105 | Adult | Grizzly Bay | Suisun Marsh | West | EDSM Provisional, USFWS Lodi | |
| 2026-01-27 11:19:00 | Longfin Smelt | None | 1 | 60 | Juvenile | Suisun Marsh | Suisun Marsh | West | Kodiak Trawl | EDSM Provisional, USFWS Lodi |
| 2026-01-27 11:36:00 | Longfin Smelt | None | 1 | 62 | Juvenile | Suisun Marsh | Suisun Marsh | West | Kodiak Trawl | EDSM Provisional, USFWS Lodi |
| 2026-01-27 11:36:00 | Longfin Smelt | None | 1 | 63 | Juvenile | Suisun Marsh | Suisun Marsh | West | Kodiak Trawl | EDSM Provisional, USFWS Lodi |
| 2026-01-27 11:36:00 | Longfin Smelt | None | 1 | 80 | Juvenile | Suisun Marsh | Suisun Marsh | West | Kodiak Trawl | EDSM Provisional, USFWS Lodi |
| 2026-01-27 11:36:00 | Longfin Smelt | None | 1 | 85 | Adult | Suisun Marsh | Suisun Marsh | West | Kodiak Trawl | EDSM Provisional, USFWS Lodi |
| 2026-01-28 11:50:00 | Longfin Smelt | None | 1 | 69 | Juvenile | Lower Napa River | Western Delta | Far West | Kodiak Trawl | EDSM Provisional, USFWS Lodi |
| 2026-01-28 12:04:00 | Longfin Smelt | None | 1 | 76 | Juvenile | Lower Napa River | Western Delta | Far West | Kodiak Trawl | EDSM Provisional, USFWS Lodi |
| 2026-01-28 12:04:00 | Longfin Smelt | None | 1 | 77 | Juvenile | Lower Napa River | Western Delta | Far West | Kodiak Trawl | EDSM Provisional, USFWS Lodi |
| 2026-01-28 12:33:00 | Longfin Smelt | None | 1 | 74 | Juvenile | Lower Napa River | Western Delta | Far West | Kodiak Trawl | EDSM Provisional, USFWS Lodi |
| 2026-01-29 10:12:00 | Longfin Smelt | None | 1 | 83 | Juvenile | Honker Bay | Suisun Bay | West | Kodiak Trawl | EDSM Provisional, USFWS Lodi |
| 2026-02-06 10:51:00 | Longfin Smelt | None | 1 | 79 | Juvenile | Grizzly Bay | Suisun Marsh | West | Kodiak Trawl | EDSM Provisional, USFWS Lodi |
| 2026-02-06 11:53:00 | Longfin Smelt | None | 1 | 79 | Juvenile | Grizzly Bay | Suisun Marsh | West | Kodiak Trawl | EDSM Provisional, USFWS Lodi |
| 2026-02-06 12:22:00 | Longfin Smelt | None | 1 | 77 | Juvenile | Grizzly Bay | Suisun Marsh | West | Kodiak Trawl | EDSM Provisional, USFWS Lodi |
| 2026-02-09 11:38:00 | Longfin Smelt | None | 1 | 73 | Juvenile | East San Pablo Bay | Western Delta | Far West | Kodiak Trawl | EDSM Provisional, USFWS Lodi |
| 2026-02-10 09:34:00 | Longfin Smelt | None | 1 | 72 | Juvenile | Grizzly Bay | Suisun Marsh | West | Kodiak Trawl | EDSM Provisional, USFWS Lodi |
| 2026-02-10 09:34:00 | Longfin Smelt | None | 1 | 74 | Juvenile | Grizzly Bay | Suisun Marsh | West | Kodiak Trawl | EDSM Provisional, USFWS Lodi |
| 2026-02-10 09:34:00 | Longfin Smelt | None | 1 | 76 | Juvenile | Grizzly Bay | Suisun Marsh | West | Kodiak Trawl | EDSM Provisional, USFWS Lodi |
| 2026-02-10 09:34:00 | Longfin Smelt | None | 1 | 81 | Juvenile | Grizzly Bay | Suisun Marsh | West | Kodiak Trawl | EDSM Provisional, USFWS Lodi |
| 2026-02-10 09:34:00 | Longfin Smelt | None | 1 | 86 | Adult | Grizzly Bay | Suisun Marsh | West | Kodiak Trawl | EDSM Provisional, USFWS Lodi |
| 2026-02-10 09:34:00 | Longfin Smelt | None | 1 | 88 | Adult | Grizzly Bay | Suisun Marsh | West | Kodiak Trawl | EDSM Provisional, USFWS Lodi |
| 2026-02-10 09:34:00 | Longfin Smelt | None | 1 | 92 | Adult | Grizzly Bay | Suisun Marsh | West | Kodiak Trawl | EDSM Provisional, USFWS Lodi |
| 2026-02-10 09:49:00 | Longfin Smelt | None | 1 | 73 | Juvenile | Grizzly Bay | Suisun Marsh | West | Kodiak Trawl | EDSM Provisional, USFWS Lodi |
| 2026-02-10 09:49:00 | Longfin Smelt | None | 1 | 77 | Juvenile | Grizzly Bay | Suisun Marsh | West | Kodiak Trawl | EDSM Provisional, USFWS Lodi |
| 2026-02-10 09:49:00 | Longfin Smelt | None | 1 | 78 | Juvenile | Grizzly Bay | Suisun Marsh | West | Kodiak Trawl | EDSM Provisional, USFWS Lodi |
| 2026-02-10 09:49:00 | Longfin Smelt | None | 1 | 79 | Juvenile | Grizzly Bay | Suisun Marsh | West | Kodiak Trawl | EDSM Provisional, USFWS Lodi |
| 2026-02-10 09:49:00 | Longfin Smelt | None | 2 | 80 | Juvenile | Grizzly Bay | Suisun Marsh | West | Kodiak Trawl | EDSM Provisional, USFWS Lodi |
| 2026-02-10 09:49:00 | Longfin Smelt | None | 1 | 81 | Juvenile | Grizzly Bay | Suisun Marsh | West | Kodiak Trawl | EDSM Provisional, USFWS Lodi |
| 2026-02-10 09:49:00 | Longfin Smelt | None | 1 | 84 | Juvenile | Grizzly Bay | Suisun Marsh | West | Kodiak Trawl | EDSM Provisional, USFWS Lodi |
| 2026-02-10 09:49:00 | Longfin Smelt | None | 1 | 92 | Adult | Grizzly Bay | Suisun Marsh | West | Kodiak Trawl | EDSM Provisional, USFWS Lodi |
| 2026-02-10 09:49:00 | Longfin Smelt | None | 1 | 99 | Adult | Grizzly Bay | Suisun Marsh | West | Kodiak Trawl | EDSM Provisional, USFWS Lodi |
| 2026-02-10 09:49:00 | Longfin Smelt | None | 2 | 103 | Adult | Grizzly Bay | Suisun Marsh | West | Kodiak Trawl | EDSM Provisional, USFWS Lodi |
| 2026-02-10 10:03:00 | Longfin Smelt | None | 1 | 77 | Juvenile | Grizzly Bay | Suisun Marsh | West | Kodiak Trawl | EDSM Provisional, USFWS Lodi |
| 2026-02-10 10:03:00 | Longfin Smelt | None | 1 | 79 | Juvenile | Grizzly Bay | Suisun Marsh | West | Kodiak Trawl | EDSM Provisional, USFWS Lodi |
| 2026-02-10 10:18:00 | Longfin Smelt | None | 1 | 64 | Juvenile | Grizzly Bay | Suisun Marsh | West | Kodiak Trawl | EDSM Provisional, USFWS Lodi |
| 2026-02-10 10:18:00 | Longfin Smelt | None | 1 | 67 | Juvenile | Grizzly Bay | Suisun Marsh | West | Kodiak Trawl | EDSM Provisional, USFWS Lodi |
| 2026-02-10 10:18:00 | Longfin Smelt | None | 1 | 73 | Juvenile | Grizzly Bay | Suisun Marsh | West | Kodiak Trawl | EDSM Provisional, USFWS Lodi |
| 2026-02-10 10:18:00 | Longfin Smelt | None | 1 | 77 | Juvenile | Grizzly Bay | Suisun Marsh | West | Kodiak Trawl | EDSM Provisional, USFWS Lodi |
| 2026-02-10 10:18:00 | Longfin Smelt | None | 1 | 83 | Juvenile | Grizzly Bay | Suisun Marsh | West | Kodiak Trawl | EDSM Provisional, USFWS Lodi |
| 2026-02-10 10:18:00 | Longfin Smelt | None | 1 | 85 | Adult | Grizzly Bay | Suisun Marsh | West | Kodiak Trawl | EDSM Provisional, USFWS Lodi |
| 2026-02-10 11:17:00 | Longfin Smelt | None | 1 | 70 | Juvenile | Suisun Marsh | Suisun Marsh | West | Kodiak Trawl | EDSM Provisional, USFWS Lodi |
| 2026-02-10 11:32:00 | Longfin Smelt | None | 1 | 68 | Juvenile | Suisun Marsh | Suisun Marsh | West | Kodiak Trawl | EDSM Provisional, USFWS Lodi |
| 2026-02-12 10:34:00 | Longfin Smelt | None | 1 | 77 | Juvenile | Confluence | Suisun Bay | West | Kodiak Trawl | EDSM Provisional, USFWS Lodi |
| 2026-02-12 10:34:00 | Longfin Smelt | None | 1 | 80 | Juvenile | Confluence | Suisun Bay | West | Kodiak Trawl | EDSM Provisional, USFWS Lodi |
| 2026-02-12 10:34:00 | Longfin Smelt | None | 1 | 82 | Juvenile | Confluence | Suisun Bay | West | Kodiak Trawl | EDSM Provisional, USFWS Lodi |
| 2026-02-17 12:37:00 | Longfin Smelt | None | 1 | 80 | Juvenile | Mid Suisun Bay | Suisun Bay | West | Kodiak Trawl | EDSM Provisional, USFWS Lodi |
| 2026-02-20 08:48:00 | Longfin Smelt | None | 1 | 69 | Juvenile | East San Pablo Bay | Western Delta | Far West | Kodiak Trawl | EDSM Provisional, USFWS Lodi |
| 2026-02-20 08:48:00 | Longfin Smelt | None | 1 | 70 | Juvenile | East San Pablo Bay | Western Delta | Far West | Kodiak Trawl | EDSM Provisional, USFWS Lodi |
| 2026-02-20 08:48:00 | Longfin Smelt | None | 1 | 82 | Juvenile | East San Pablo Bay | Western Delta | Far West | Kodiak Trawl | EDSM Provisional, USFWS Lodi |
| 2026-02-20 08:48:00 | Longfin Smelt | None | 1 | 93 | Adult | East San Pablo Bay | Western Delta | Far West | Kodiak Trawl | EDSM Provisional, USFWS Lodi |
| 2026-02-20 09:04:00 | Longfin Smelt | None | 1 | 62 | Juvenile | East San Pablo Bay | Western Delta | Far West | Kodiak Trawl | EDSM Provisional, USFWS Lodi |
| 2026-02-20 09:04:00 | Longfin Smelt | None | 1 | 74 | Juvenile | East San Pablo Bay | Western Delta | Far West | Kodiak Trawl | EDSM Provisional, USFWS Lodi |
| 2026-02-20 09:04:00 | Longfin Smelt | None | 1 | 79 | Juvenile | East San Pablo Bay | Western Delta | Far West | Kodiak Trawl | EDSM Provisional, USFWS Lodi |
| 2026-02-20 09:04:00 | Longfin Smelt | None | 1 | 84 | Juvenile | East San Pablo Bay | Western Delta | Far West | Kodiak Trawl | EDSM Provisional, USFWS Lodi |
| 2026-02-20 09:19:00 | Longfin Smelt | None | 1 | 71 | Juvenile | East San Pablo Bay | Western Delta | Far West | Kodiak Trawl | EDSM Provisional, USFWS Lodi |
| 2026-02-20 09:19:00 | Longfin Smelt | None | 1 | 76 | Juvenile | East San Pablo Bay | Western Delta | Far West | Kodiak Trawl | EDSM Provisional, USFWS Lodi |
| 2026-02-20 09:19:00 | Longfin Smelt | None | 1 | 78 | Juvenile | East San Pablo Bay | Western Delta | Far West | Kodiak Trawl | EDSM Provisional, USFWS Lodi |
| 2026-02-20 09:33:00 | Longfin Smelt | None | 1 | 69 | Juvenile | East San Pablo Bay | Western Delta | Far West | Kodiak Trawl | EDSM Provisional, USFWS Lodi |
| 2026-02-20 09:33:00 | Longfin Smelt | None | 1 | 75 | Juvenile | East San Pablo Bay | Western Delta | Far West | Kodiak Trawl | EDSM Provisional, USFWS Lodi |
| 2026-02-20 09:33:00 | Longfin Smelt | None | 1 | 76 | Juvenile | East San Pablo Bay | Western Delta | Far West | Kodiak Trawl | EDSM Provisional, USFWS Lodi |
| 2026-02-20 09:33:00 | Longfin Smelt | None | 1 | 77 | Juvenile | East San Pablo Bay | Western Delta | Far West | Kodiak Trawl | EDSM Provisional, USFWS Lodi |
| 2026-02-20 09:33:00 | Longfin Smelt | None | 1 | 92 | Adult | East San Pablo Bay | Western Delta | Far West | Kodiak Trawl | EDSM Provisional, USFWS Lodi |
| 2026-02-20 11:47:00 | Longfin Smelt | None | 1 | 80 | Juvenile | Carquinez Strait | Western Delta | Far West | Kodiak Trawl | EDSM Provisional, USFWS Lodi |
| 2026-02-23 09:43:00 | Longfin Smelt | None | 1 | 79 | Juvenile | West Suisun Bay | Suisun Bay | Far West | Kodiak Trawl | EDSM Provisional, USFWS Lodi |
| 2026-02-23 09:43:00 | Longfin Smelt | None | 1 | 84 | Juvenile | West Suisun Bay | Suisun Bay | Far West | Kodiak Trawl | EDSM Provisional, USFWS Lodi |
| 2026-02-23 09:43:00 | Longfin Smelt | None | 1 | 89 | Adult | West Suisun Bay | Suisun Bay | Far West | Kodiak Trawl | EDSM Provisional, USFWS Lodi |
| 2026-02-23 09:43:00 | Longfin Smelt | None | 1 | 92 | Adult | West Suisun Bay | Suisun Bay | Far West | Kodiak Trawl | EDSM Provisional, USFWS Lodi |
| 2026-02-23 09:59:00 | Longfin Smelt | None | 1 | 80 | Juvenile | West Suisun Bay | Suisun Bay | Far West | Kodiak Trawl | EDSM Provisional, USFWS Lodi |
| 2026-02-23 10:13:00 | Longfin Smelt | None | 1 | 70 | Juvenile | West Suisun Bay | Suisun Bay | Far West | Kodiak Trawl | EDSM Provisional, USFWS Lodi |
| 2026-02-23 10:29:00 | Longfin Smelt | None | 1 | 78 | Juvenile | West Suisun Bay | Suisun Bay | Far West | Kodiak Trawl | EDSM Provisional, USFWS Lodi |
| 2026-02-23 10:29:00 | Longfin Smelt | None | 1 | 85 | Adult | West Suisun Bay | Suisun Bay | Far West | Kodiak Trawl | EDSM Provisional, USFWS Lodi |
| 2026-02-23 11:42:00 | Longfin Smelt | None | 1 | 81 | Juvenile | West Suisun Bay | Suisun Bay | Far West | Kodiak Trawl | EDSM Provisional, USFWS Lodi |
| 2026-02-23 11:58:00 | Longfin Smelt | None | 1 | 80 | Juvenile | West Suisun Bay | Suisun Bay | Far West | Kodiak Trawl | EDSM Provisional, USFWS Lodi |
| 2026-02-23 11:58:00 | Longfin Smelt | None | 1 | 81 | Juvenile | West Suisun Bay | Suisun Bay | Far West | Kodiak Trawl | EDSM Provisional, USFWS Lodi |
| 2026-02-23 11:58:00 | Longfin Smelt | None | 1 | 82 | Juvenile | West Suisun Bay | Suisun Bay | Far West | Kodiak Trawl | EDSM Provisional, USFWS Lodi |
| 2026-02-23 11:58:00 | Longfin Smelt | None | 1 | 85 | Adult | West Suisun Bay | Suisun Bay | Far West | Kodiak Trawl | EDSM Provisional, USFWS Lodi |
| 2026-02-24 09:28:00 | Longfin Smelt | None | 1 | 83 | Juvenile | Mid Suisun Bay | Suisun Bay | West | Kodiak Trawl | EDSM Provisional, USFWS Lodi |
| 2026-02-25 09:43:00 | Longfin Smelt | None | 1 | 76 | Juvenile | Grizzly Bay | Suisun Marsh | West | Kodiak Trawl | EDSM Provisional, USFWS Lodi |
| 2026-02-25 09:59:00 | Longfin Smelt | None | 1 | 68 | Juvenile | Grizzly Bay | Suisun Marsh | West | Kodiak Trawl | EDSM Provisional, USFWS Lodi |
| 2026-02-25 09:59:00 | Longfin Smelt | None | 1 | 84 | Juvenile | Grizzly Bay | Suisun Marsh | West | Kodiak Trawl | EDSM Provisional, USFWS Lodi |
| 2026-02-26 11:46:00 | Longfin Smelt | None | 1 | 82 | Juvenile | East San Pablo Bay | Western Delta | Far West | Kodiak Trawl | EDSM Provisional, USFWS Lodi |
| 2026-02-26 12:01:00 | Longfin Smelt | None | 1 | 79 | Juvenile | East San Pablo Bay | Western Delta | Far West | Kodiak Trawl | EDSM Provisional, USFWS Lodi |
| 2026-03-03 08:29:00 | Longfin Smelt | None | 1 | 74 | Juvenile | West Suisun Bay | Suisun Bay | Far West | Kodiak Trawl | EDSM Provisional, USFWS Lodi |
| 2026-03-03 11:36:00 | Longfin Smelt | None | 1 | 78 | Juvenile | Honker Bay | Suisun Bay | West | Kodiak Trawl | EDSM Provisional, USFWS Lodi |
| 2026-03-05 08:48:00 | Longfin Smelt | None | 1 | 80 | Juvenile | Carquinez Strait | Western Delta | Far West | Kodiak Trawl | EDSM Provisional, USFWS Lodi |
| 2026-03-05 08:48:00 | Longfin Smelt | None | 1 | 88 | Adult | Carquinez Strait | Western Delta | Far West | Kodiak Trawl | EDSM Provisional, USFWS Lodi |
| 2026-03-05 09:32:00 | Longfin Smelt | None | 1 | 81 | Juvenile | Carquinez Strait | Western Delta | Far West | Kodiak Trawl | EDSM Provisional, USFWS Lodi |
| 2026-03-05 09:32:00 | Longfin Smelt | None | 1 | 84 | Juvenile | Carquinez Strait | Western Delta | Far West | Kodiak Trawl | EDSM Provisional, USFWS Lodi |
| 2026-03-05 09:48:00 | Longfin Smelt | None | 1 | 89 | Adult | Carquinez Strait | Western Delta | Far West | EDSM Provisional, USFWS Lodi | |
| 2026-03-09 10:16:00 | Longfin Smelt | None | 1 | 92 | Adult | Grizzly Bay | Suisun Marsh | West | Kodiak Trawl | EDSM Provisional, USFWS Lodi |
| 2026-03-09 11:53:00 | Longfin Smelt | None | 1 | 85 | Adult | Grizzly Bay | Suisun Marsh | West | Kodiak Trawl | EDSM Provisional, USFWS Lodi |
| 2026-03-10 09:46:00 | Longfin Smelt | None | 1 | 67 | Juvenile | East San Pablo Bay | Western Delta | Far West | Kodiak Trawl | EDSM Provisional, USFWS Lodi |
| 2026-03-17 10:26:00 | Longfin Smelt | None | 1 | 88 | Adult | Lower Napa River | Western Delta | Far West | Kodiak Trawl | EDSM Provisional, USFWS Lodi |
| 2026-03-17 10:58:00 | Longfin Smelt | None | 1 | 81 | Juvenile | Lower Napa River | Western Delta | Far West | Kodiak Trawl | EDSM Provisional, USFWS Lodi |
| 2026-03-18 08:37:00 | Longfin Smelt | None | 1 | 88 | Adult | Suisun Marsh | Suisun Marsh | West | Kodiak Trawl | EDSM Provisional, USFWS Lodi |
| 2026-03-23 12:06:00 | Longfin Smelt | None | 2 | 74 | Juvenile | West Suisun Bay | Suisun Bay | Far West | Kodiak Trawl | EDSM Provisional, USFWS Lodi |
| 2026-03-23 12:06:00 | Longfin Smelt | None | 1 | 76 | Juvenile | West Suisun Bay | Suisun Bay | Far West | Kodiak Trawl | EDSM Provisional, USFWS Lodi |
| 2026-03-23 12:06:00 | Longfin Smelt | None | 1 | 79 | Juvenile | West Suisun Bay | Suisun Bay | Far West | Kodiak Trawl | EDSM Provisional, USFWS Lodi |
| 2026-03-23 12:06:00 | Longfin Smelt | None | 1 | 80 | Juvenile | West Suisun Bay | Suisun Bay | Far West | Kodiak Trawl | EDSM Provisional, USFWS Lodi |
| 2026-03-23 12:06:00 | Longfin Smelt | None | 1 | 82 | Juvenile | West Suisun Bay | Suisun Bay | Far West | Kodiak Trawl | EDSM Provisional, USFWS Lodi |
| 2026-03-24 08:43:00 | Longfin Smelt | None | 1 | 75 | Juvenile | Grizzly Bay | Suisun Marsh | West | Kodiak Trawl | EDSM Provisional, USFWS Lodi |
| 2026-03-24 09:19:00 | Longfin Smelt | None | 1 | 74 | Juvenile | Suisun Marsh | Suisun Marsh | West | Kodiak Trawl | EDSM Provisional, USFWS Lodi |
| 2026-03-24 09:19:00 | Longfin Smelt | None | 1 | 83 | Juvenile | Suisun Marsh | Suisun Marsh | West | Kodiak Trawl | EDSM Provisional, USFWS Lodi |
| 2026-03-24 09:47:00 | Longfin Smelt | None | 1 | 81 | Juvenile | Suisun Marsh | Suisun Marsh | West | Kodiak Trawl | EDSM Provisional, USFWS Lodi |
| 2026-03-25 10:13:00 | Longfin Smelt | None | 1 | 86 | Adult | Sacramento River near Rio Vista | Lower Sacramento | North | Kodiak Trawl | EDSM Provisional, USFWS Lodi |
| 2026-03-25 13:31:00 | Longfin Smelt | None | 1 | 72 | Juvenile | Carquinez Strait | Western Delta | Far West | Kodiak Trawl | EDSM Provisional, USFWS Lodi |
| 2026-03-30 08:31:23 | Longfin Smelt | None | 2 | 7.8 | Larva | Grizzly Bay | Suisun Marsh | West | 20mm | EDSM Provisional DR, USFWS Lodi |
| 2026-03-30 08:31:23 | Longfin Smelt | None | 1 | 8.2 | Larva | Grizzly Bay | Suisun Marsh | West | 20mm | EDSM Provisional DR, USFWS Lodi |
| 2026-03-30 08:31:23 | Longfin Smelt | None | 1 | 8.3 | Larva | Grizzly Bay | Suisun Marsh | West | 20mm | EDSM Provisional DR, USFWS Lodi |
| 2026-03-30 08:31:23 | Longfin Smelt | None | 1 | 9.3 | Larva | Grizzly Bay | Suisun Marsh | West | 20mm | EDSM Provisional DR, USFWS Lodi |
| 2026-03-30 08:31:23 | Longfin Smelt | None | 1 | 9.5 | Larva | Grizzly Bay | Suisun Marsh | West | 20mm | EDSM Provisional DR, USFWS Lodi |
| 2026-03-30 08:31:23 | Longfin Smelt | None | 1 | 10.5 | Larva | Grizzly Bay | Suisun Marsh | West | 20mm | EDSM Provisional DR, USFWS Lodi |
| 2026-03-30 08:31:23 | Longfin Smelt | None | 1 | 11 | Larva | Grizzly Bay | Suisun Marsh | West | 20mm | EDSM Provisional DR, USFWS Lodi |
| 2026-03-30 08:31:23 | Longfin Smelt | None | 1 | 11.2 | Larva | Grizzly Bay | Suisun Marsh | West | 20mm | EDSM Provisional DR, USFWS Lodi |
| 2026-03-30 08:31:23 | Longfin Smelt | None | 1 | 11.5 | Larva | Grizzly Bay | Suisun Marsh | West | 20mm | EDSM Provisional DR, USFWS Lodi |
| 2026-03-30 08:31:23 | Longfin Smelt | None | 1 | 12 | Larva | Grizzly Bay | Suisun Marsh | West | 20mm | EDSM Provisional DR, USFWS Lodi |
| 2026-03-30 08:31:23 | Longfin Smelt | None | 1 | 12.3 | Larva | Grizzly Bay | Suisun Marsh | West | 20mm | EDSM Provisional DR, USFWS Lodi |
| 2026-03-30 08:31:23 | Longfin Smelt | None | 2 | 12.5 | Larva | Grizzly Bay | Suisun Marsh | West | 20mm | EDSM Provisional DR, USFWS Lodi |
| 2026-03-30 08:31:23 | Longfin Smelt | None | 1 | 12.8 | Larva | Grizzly Bay | Suisun Marsh | West | 20mm | EDSM Provisional DR, USFWS Lodi |
| 2026-03-30 08:31:23 | Longfin Smelt | None | 2 | 13 | Larva | Grizzly Bay | Suisun Marsh | West | 20mm | EDSM Provisional DR, USFWS Lodi |
| 2026-03-30 08:31:23 | Longfin Smelt | None | 1 | 13.2 | Larva | Grizzly Bay | Suisun Marsh | West | 20mm | EDSM Provisional DR, USFWS Lodi |
| 2026-03-30 08:31:23 | Longfin Smelt | None | 1 | 13.5 | Larva | Grizzly Bay | Suisun Marsh | West | 20mm | EDSM Provisional DR, USFWS Lodi |
| 2026-03-30 08:31:23 | Longfin Smelt | None | 2 | 14 | Larva | Grizzly Bay | Suisun Marsh | West | 20mm | EDSM Provisional DR, USFWS Lodi |
| 2026-03-30 08:31:23 | Longfin Smelt | None | 2 | 14.3 | Larva | Grizzly Bay | Suisun Marsh | West | 20mm | EDSM Provisional DR, USFWS Lodi |
| 2026-03-30 08:31:23 | Longfin Smelt | None | 6 | 15 | Larva | Grizzly Bay | Suisun Marsh | West | 20mm | EDSM Provisional DR, USFWS Lodi |
| 2026-03-30 08:31:23 | Longfin Smelt | None | 2 | 15.1 | Larva | Grizzly Bay | Suisun Marsh | West | 20mm | EDSM Provisional DR, USFWS Lodi |
| 2026-03-30 08:31:23 | Longfin Smelt | None | 3 | 15.5 | Larva | Grizzly Bay | Suisun Marsh | West | 20mm | EDSM Provisional DR, USFWS Lodi |
| 2026-03-30 08:31:23 | Longfin Smelt | None | 2 | 15.6 | Larva | Grizzly Bay | Suisun Marsh | West | 20mm | EDSM Provisional DR, USFWS Lodi |
| 2026-03-30 08:31:23 | Longfin Smelt | None | 1 | 15.8 | Larva | Grizzly Bay | Suisun Marsh | West | 20mm | EDSM Provisional DR, USFWS Lodi |
| 2026-03-30 08:31:23 | Longfin Smelt | None | 1 | 16 | Larva | Grizzly Bay | Suisun Marsh | West | 20mm | EDSM Provisional DR, USFWS Lodi |
| 2026-03-30 08:31:23 | Longfin Smelt | None | 1 | 16.1 | Larva | Grizzly Bay | Suisun Marsh | West | 20mm | EDSM Provisional DR, USFWS Lodi |
| 2026-03-30 08:31:23 | Longfin Smelt | None | 2 | 16.5 | Larva | Grizzly Bay | Suisun Marsh | West | 20mm | EDSM Provisional DR, USFWS Lodi |
| 2026-03-30 08:31:23 | Longfin Smelt | None | 1 | 16.8 | Larva | Grizzly Bay | Suisun Marsh | West | 20mm | EDSM Provisional DR, USFWS Lodi |
| 2026-03-30 08:31:23 | Longfin Smelt | None | 2 | 17 | Larva | Grizzly Bay | Suisun Marsh | West | 20mm | EDSM Provisional DR, USFWS Lodi |
| 2026-03-30 08:31:23 | Longfin Smelt | None | 1 | 17.5 | Larva | Grizzly Bay | Suisun Marsh | West | 20mm | EDSM Provisional DR, USFWS Lodi |
| 2026-03-30 08:31:23 | Longfin Smelt | None | 3 | 18 | Larva | Grizzly Bay | Suisun Marsh | West | 20mm | EDSM Provisional DR, USFWS Lodi |
| 2026-03-30 08:31:23 | Longfin Smelt | None | 1 | 18.3 | Larva | Grizzly Bay | Suisun Marsh | West | 20mm | EDSM Provisional DR, USFWS Lodi |
| 2026-03-30 08:31:23 | Longfin Smelt | None | 1 | 18.6 | Larva | Grizzly Bay | Suisun Marsh | West | 20mm | EDSM Provisional DR, USFWS Lodi |
| 2026-03-30 08:31:23 | Longfin Smelt | None | 1 | 19 | Larva | Grizzly Bay | Suisun Marsh | West | 20mm | EDSM Provisional DR, USFWS Lodi |
| 2026-03-30 08:51:30 | Longfin Smelt | None | 1 | 11 | Larva | Grizzly Bay | Suisun Marsh | West | 20mm | EDSM Provisional DR, USFWS Lodi |
| 2026-03-30 08:51:30 | Longfin Smelt | None | 1 | 11.2 | Larva | Grizzly Bay | Suisun Marsh | West | 20mm | EDSM Provisional DR, USFWS Lodi |
| 2026-03-30 08:51:30 | Longfin Smelt | None | 4 | 12.1 | Larva | Grizzly Bay | Suisun Marsh | West | 20mm | EDSM Provisional DR, USFWS Lodi |
| 2026-03-30 08:51:30 | Longfin Smelt | None | 1 | 12.2 | Larva | Grizzly Bay | Suisun Marsh | West | 20mm | EDSM Provisional DR, USFWS Lodi |
| 2026-03-30 08:51:30 | Longfin Smelt | None | 1 | 12.5 | Larva | Grizzly Bay | Suisun Marsh | West | 20mm | EDSM Provisional DR, USFWS Lodi |
| 2026-03-30 08:51:30 | Longfin Smelt | None | 2 | 12.9 | Larva | Grizzly Bay | Suisun Marsh | West | 20mm | EDSM Provisional DR, USFWS Lodi |
| 2026-03-30 08:51:30 | Longfin Smelt | None | 2 | 13.1 | Larva | Grizzly Bay | Suisun Marsh | West | 20mm | EDSM Provisional DR, USFWS Lodi |
| 2026-03-30 08:51:30 | Longfin Smelt | None | 1 | 13.2 | Larva | Grizzly Bay | Suisun Marsh | West | 20mm | EDSM Provisional DR, USFWS Lodi |
| 2026-03-30 08:51:30 | Longfin Smelt | None | 1 | 13.3 | Larva | Grizzly Bay | Suisun Marsh | West | 20mm | EDSM Provisional DR, USFWS Lodi |
| 2026-03-30 08:51:30 | Longfin Smelt | None | 1 | 13.9 | Larva | Grizzly Bay | Suisun Marsh | West | 20mm | EDSM Provisional DR, USFWS Lodi |
| 2026-03-30 08:51:30 | Longfin Smelt | None | 3 | 14 | Larva | Grizzly Bay | Suisun Marsh | West | 20mm | EDSM Provisional DR, USFWS Lodi |
| 2026-03-30 08:51:30 | Longfin Smelt | None | 2 | 14.2 | Larva | Grizzly Bay | Suisun Marsh | West | 20mm | EDSM Provisional DR, USFWS Lodi |
| 2026-03-30 08:51:30 | Longfin Smelt | None | 1 | 14.5 | Larva | Grizzly Bay | Suisun Marsh | West | 20mm | EDSM Provisional DR, USFWS Lodi |
| 2026-03-30 08:51:30 | Longfin Smelt | None | 1 | 14.8 | Larva | Grizzly Bay | Suisun Marsh | West | 20mm | EDSM Provisional DR, USFWS Lodi |
| 2026-03-30 08:51:30 | Longfin Smelt | None | 3 | 14.9 | Larva | Grizzly Bay | Suisun Marsh | West | 20mm | EDSM Provisional DR, USFWS Lodi |
| 2026-03-30 08:51:30 | Longfin Smelt | None | 1 | 15 | Larva | Grizzly Bay | Suisun Marsh | West | 20mm | EDSM Provisional DR, USFWS Lodi |
| 2026-03-30 08:51:30 | Longfin Smelt | None | 4 | 15.2 | Larva | Grizzly Bay | Suisun Marsh | West | 20mm | EDSM Provisional DR, USFWS Lodi |
| 2026-03-30 08:51:30 | Longfin Smelt | None | 1 | 15.3 | Larva | Grizzly Bay | Suisun Marsh | West | 20mm | EDSM Provisional DR, USFWS Lodi |
| 2026-03-30 08:51:30 | Longfin Smelt | None | 1 | 15.5 | Larva | Grizzly Bay | Suisun Marsh | West | 20mm | EDSM Provisional DR, USFWS Lodi |
| 2026-03-30 08:51:30 | Longfin Smelt | None | 1 | 16 | Larva | Grizzly Bay | Suisun Marsh | West | 20mm | EDSM Provisional DR, USFWS Lodi |
| 2026-03-30 08:51:30 | Longfin Smelt | None | 2 | 16.1 | Larva | Grizzly Bay | Suisun Marsh | West | 20mm | EDSM Provisional DR, USFWS Lodi |
| 2026-03-30 08:51:30 | Longfin Smelt | None | 1 | 16.2 | Larva | Grizzly Bay | Suisun Marsh | West | 20mm | EDSM Provisional DR, USFWS Lodi |
| 2026-03-30 08:51:30 | Longfin Smelt | None | 1 | 16.5 | Larva | Grizzly Bay | Suisun Marsh | West | 20mm | EDSM Provisional DR, USFWS Lodi |
| 2026-03-30 08:51:30 | Longfin Smelt | None | 1 | 16.9 | Larva | Grizzly Bay | Suisun Marsh | West | 20mm | EDSM Provisional DR, USFWS Lodi |
| 2026-03-30 08:51:30 | Longfin Smelt | None | 3 | 17 | Larva | Grizzly Bay | Suisun Marsh | West | 20mm | EDSM Provisional DR, USFWS Lodi |
| 2026-03-30 08:51:30 | Longfin Smelt | None | 2 | 17.1 | Larva | Grizzly Bay | Suisun Marsh | West | 20mm | EDSM Provisional DR, USFWS Lodi |
| 2026-03-30 08:51:30 | Longfin Smelt | None | 1 | 17.2 | Larva | Grizzly Bay | Suisun Marsh | West | 20mm | EDSM Provisional DR, USFWS Lodi |
| 2026-03-30 08:51:30 | Longfin Smelt | None | 1 | 17.9 | Larva | Grizzly Bay | Suisun Marsh | West | 20mm | EDSM Provisional DR, USFWS Lodi |
| 2026-03-30 08:51:30 | Longfin Smelt | None | 1 | 18 | Larva | Grizzly Bay | Suisun Marsh | West | 20mm | EDSM Provisional DR, USFWS Lodi |
| 2026-03-30 08:51:30 | Longfin Smelt | None | 1 | 19 | Larva | Grizzly Bay | Suisun Marsh | West | 20mm | EDSM Provisional DR, USFWS Lodi |
| 2026-03-30 08:51:30 | Longfin Smelt | None | 1 | 19.1 | Larva | Grizzly Bay | Suisun Marsh | West | 20mm | EDSM Provisional DR, USFWS Lodi |
| 2026-03-30 08:51:30 | Longfin Smelt | None | 1 | 19.6 | Larva | Grizzly Bay | Suisun Marsh | West | 20mm | EDSM Provisional DR, USFWS Lodi |
| 2026-03-30 08:51:30 | Longfin Smelt | None | 1 | 20 | Juvenile | Grizzly Bay | Suisun Marsh | West | 20mm | EDSM Provisional DR, USFWS Lodi |
| 2026-03-30 08:51:30 | Longfin Smelt | None | 25 | NA | Grizzly Bay | Suisun Marsh | West | 20mm | EDSM Provisional DR, USFWS Lodi | |
| 2026-03-30 09:17:17 | Longfin Smelt | None | 1 | 10.1 | Larva | Grizzly Bay | Suisun Marsh | West | 20mm | EDSM Provisional DR, USFWS Lodi |
| 2026-03-30 09:17:17 | Longfin Smelt | None | 1 | 10.6 | Larva | Grizzly Bay | Suisun Marsh | West | 20mm | EDSM Provisional DR, USFWS Lodi |
| 2026-03-30 09:17:17 | Longfin Smelt | None | 1 | 10.9 | Larva | Grizzly Bay | Suisun Marsh | West | 20mm | EDSM Provisional DR, USFWS Lodi |
| 2026-03-30 09:17:17 | Longfin Smelt | None | 3 | 11 | Larva | Grizzly Bay | Suisun Marsh | West | 20mm | EDSM Provisional DR, USFWS Lodi |
| 2026-03-30 09:17:17 | Longfin Smelt | None | 1 | 11.1 | Larva | Grizzly Bay | Suisun Marsh | West | 20mm | EDSM Provisional DR, USFWS Lodi |
| 2026-03-30 09:17:17 | Longfin Smelt | None | 3 | 11.4 | Larva | Grizzly Bay | Suisun Marsh | West | 20mm | EDSM Provisional DR, USFWS Lodi |
| 2026-03-30 09:17:17 | Longfin Smelt | None | 2 | 11.5 | Larva | Grizzly Bay | Suisun Marsh | West | 20mm | EDSM Provisional DR, USFWS Lodi |
| 2026-03-30 09:17:17 | Longfin Smelt | None | 1 | 11.6 | Larva | Grizzly Bay | Suisun Marsh | West | 20mm | EDSM Provisional DR, USFWS Lodi |
| 2026-03-30 09:17:17 | Longfin Smelt | None | 1 | 11.9 | Larva | Grizzly Bay | Suisun Marsh | West | 20mm | EDSM Provisional DR, USFWS Lodi |
| 2026-03-30 09:17:17 | Longfin Smelt | None | 2 | 12.1 | Larva | Grizzly Bay | Suisun Marsh | West | 20mm | EDSM Provisional DR, USFWS Lodi |
| 2026-03-30 09:17:17 | Longfin Smelt | None | 1 | 12.2 | Larva | Grizzly Bay | Suisun Marsh | West | 20mm | EDSM Provisional DR, USFWS Lodi |
| 2026-03-30 09:17:17 | Longfin Smelt | None | 1 | 12.4 | Larva | Grizzly Bay | Suisun Marsh | West | 20mm | EDSM Provisional DR, USFWS Lodi |
| 2026-03-30 09:17:17 | Longfin Smelt | None | 3 | 12.5 | Larva | Grizzly Bay | Suisun Marsh | West | 20mm | EDSM Provisional DR, USFWS Lodi |
| 2026-03-30 09:17:17 | Longfin Smelt | None | 1 | 12.8 | Larva | Grizzly Bay | Suisun Marsh | West | 20mm | EDSM Provisional DR, USFWS Lodi |
| 2026-03-30 09:17:17 | Longfin Smelt | None | 3 | 12.9 | Larva | Grizzly Bay | Suisun Marsh | West | 20mm | EDSM Provisional DR, USFWS Lodi |
| 2026-03-30 09:17:17 | Longfin Smelt | None | 3 | 13.1 | Larva | Grizzly Bay | Suisun Marsh | West | 20mm | EDSM Provisional DR, USFWS Lodi |
| 2026-03-30 09:17:17 | Longfin Smelt | None | 2 | 13.2 | Larva | Grizzly Bay | Suisun Marsh | West | 20mm | EDSM Provisional DR, USFWS Lodi |
| 2026-03-30 09:17:17 | Longfin Smelt | None | 3 | 13.4 | Larva | Grizzly Bay | Suisun Marsh | West | 20mm | EDSM Provisional DR, USFWS Lodi |
| 2026-03-30 09:17:17 | Longfin Smelt | None | 2 | 13.5 | Larva | Grizzly Bay | Suisun Marsh | West | 20mm | EDSM Provisional DR, USFWS Lodi |
| 2026-03-30 09:17:17 | Longfin Smelt | None | 1 | 13.6 | Larva | Grizzly Bay | Suisun Marsh | West | 20mm | EDSM Provisional DR, USFWS Lodi |
| 2026-03-30 09:17:17 | Longfin Smelt | None | 2 | 13.7 | Larva | Grizzly Bay | Suisun Marsh | West | 20mm | EDSM Provisional DR, USFWS Lodi |
| 2026-03-30 09:17:17 | Longfin Smelt | None | 1 | 13.8 | Larva | Grizzly Bay | Suisun Marsh | West | 20mm | EDSM Provisional DR, USFWS Lodi |
| 2026-03-30 09:17:17 | Longfin Smelt | None | 1 | 13.9 | Larva | Grizzly Bay | Suisun Marsh | West | 20mm | EDSM Provisional DR, USFWS Lodi |
| 2026-03-30 09:17:17 | Longfin Smelt | None | 1 | 14 | Larva | Grizzly Bay | Suisun Marsh | West | 20mm | EDSM Provisional DR, USFWS Lodi |
| 2026-03-30 09:17:17 | Longfin Smelt | None | 1 | 14.2 | Larva | Grizzly Bay | Suisun Marsh | West | 20mm | EDSM Provisional DR, USFWS Lodi |
| 2026-03-30 09:17:17 | Longfin Smelt | None | 1 | 14.3 | Larva | Grizzly Bay | Suisun Marsh | West | 20mm | EDSM Provisional DR, USFWS Lodi |
| 2026-03-30 09:17:17 | Longfin Smelt | None | 3 | 14.5 | Larva | Grizzly Bay | Suisun Marsh | West | 20mm | EDSM Provisional DR, USFWS Lodi |
| 2026-03-30 09:17:17 | Longfin Smelt | None | 1 | 14.7 | Larva | Grizzly Bay | Suisun Marsh | West | 20mm | EDSM Provisional DR, USFWS Lodi |
| 2026-03-30 09:17:17 | Longfin Smelt | None | 1 | 14.8 | Larva | Grizzly Bay | Suisun Marsh | West | 20mm | EDSM Provisional DR, USFWS Lodi |
| 2026-03-30 09:17:17 | Longfin Smelt | None | 3 | 15 | Larva | Grizzly Bay | Suisun Marsh | West | 20mm | EDSM Provisional DR, USFWS Lodi |
| 2026-03-30 09:17:17 | Longfin Smelt | None | 1 | 15.2 | Larva | Grizzly Bay | Suisun Marsh | West | 20mm | EDSM Provisional DR, USFWS Lodi |
| 2026-03-30 09:17:17 | Longfin Smelt | None | 1 | 15.5 | Larva | Grizzly Bay | Suisun Marsh | West | 20mm | EDSM Provisional DR, USFWS Lodi |
| 2026-03-30 09:17:17 | Longfin Smelt | None | 2 | 15.8 | Larva | Grizzly Bay | Suisun Marsh | West | 20mm | EDSM Provisional DR, USFWS Lodi |
| 2026-03-30 09:17:17 | Longfin Smelt | None | 1 | 15.9 | Larva | Grizzly Bay | Suisun Marsh | West | 20mm | EDSM Provisional DR, USFWS Lodi |
| 2026-03-30 09:17:17 | Longfin Smelt | None | 1 | 16 | Larva | Grizzly Bay | Suisun Marsh | West | 20mm | EDSM Provisional DR, USFWS Lodi |
| 2026-03-30 09:17:17 | Longfin Smelt | None | 2 | 16.1 | Larva | Grizzly Bay | Suisun Marsh | West | 20mm | EDSM Provisional DR, USFWS Lodi |
| 2026-03-30 09:17:17 | Longfin Smelt | None | 1 | 17 | Larva | Grizzly Bay | Suisun Marsh | West | 20mm | EDSM Provisional DR, USFWS Lodi |
| 2026-03-30 09:17:17 | Longfin Smelt | None | 1 | 17.1 | Larva | Grizzly Bay | Suisun Marsh | West | 20mm | EDSM Provisional DR, USFWS Lodi |
| 2026-03-30 09:17:17 | Longfin Smelt | None | 1 | 17.2 | Larva | Grizzly Bay | Suisun Marsh | West | 20mm | EDSM Provisional DR, USFWS Lodi |
| 2026-03-30 09:17:17 | Longfin Smelt | None | 1 | 17.5 | Larva | Grizzly Bay | Suisun Marsh | West | 20mm | EDSM Provisional DR, USFWS Lodi |
| 2026-03-30 09:17:17 | Longfin Smelt | None | 1 | 18 | Larva | Grizzly Bay | Suisun Marsh | West | 20mm | EDSM Provisional DR, USFWS Lodi |
| 2026-03-30 09:17:17 | Longfin Smelt | None | 1 | 18.2 | Larva | Grizzly Bay | Suisun Marsh | West | 20mm | EDSM Provisional DR, USFWS Lodi |
| 2026-03-30 09:17:17 | Longfin Smelt | None | 1 | 18.5 | Larva | Grizzly Bay | Suisun Marsh | West | 20mm | EDSM Provisional DR, USFWS Lodi |
| 2026-03-30 09:17:17 | Longfin Smelt | None | 9 | NA | Grizzly Bay | Suisun Marsh | West | 20mm | EDSM Provisional DR, USFWS Lodi | |
| 2026-03-30 09:34:06 | Longfin Smelt | None | 1 | 7.3 | Larva | Grizzly Bay | Suisun Marsh | West | 20mm | EDSM Provisional DR, USFWS Lodi |
| 2026-03-30 09:34:06 | Longfin Smelt | None | 1 | 7.7 | Larva | Grizzly Bay | Suisun Marsh | West | 20mm | EDSM Provisional DR, USFWS Lodi |
| 2026-03-30 09:34:06 | Longfin Smelt | None | 1 | 7.9 | Larva | Grizzly Bay | Suisun Marsh | West | 20mm | EDSM Provisional DR, USFWS Lodi |
| 2026-03-30 09:34:06 | Longfin Smelt | None | 1 | 8.9 | Larva | Grizzly Bay | Suisun Marsh | West | 20mm | EDSM Provisional DR, USFWS Lodi |
| 2026-03-30 09:34:06 | Longfin Smelt | None | 1 | 9.9 | Larva | Grizzly Bay | Suisun Marsh | West | 20mm | EDSM Provisional DR, USFWS Lodi |
| 2026-03-30 09:34:06 | Longfin Smelt | None | 1 | 10.2 | Larva | Grizzly Bay | Suisun Marsh | West | 20mm | EDSM Provisional DR, USFWS Lodi |
| 2026-03-30 09:34:06 | Longfin Smelt | None | 1 | 11 | Larva | Grizzly Bay | Suisun Marsh | West | 20mm | EDSM Provisional DR, USFWS Lodi |
| 2026-03-30 09:34:06 | Longfin Smelt | None | 3 | 11.5 | Larva | Grizzly Bay | Suisun Marsh | West | 20mm | EDSM Provisional DR, USFWS Lodi |
| 2026-03-30 09:34:06 | Longfin Smelt | None | 1 | 11.7 | Larva | Grizzly Bay | Suisun Marsh | West | 20mm | EDSM Provisional DR, USFWS Lodi |
| 2026-03-30 09:34:06 | Longfin Smelt | None | 1 | 11.9 | Larva | Grizzly Bay | Suisun Marsh | West | 20mm | EDSM Provisional DR, USFWS Lodi |
| 2026-03-30 09:34:06 | Longfin Smelt | None | 1 | 12 | Larva | Grizzly Bay | Suisun Marsh | West | 20mm | EDSM Provisional DR, USFWS Lodi |
| 2026-03-30 09:34:06 | Longfin Smelt | None | 1 | 12.8 | Larva | Grizzly Bay | Suisun Marsh | West | 20mm | EDSM Provisional DR, USFWS Lodi |
| 2026-03-30 09:34:06 | Longfin Smelt | None | 3 | 14 | Larva | Grizzly Bay | Suisun Marsh | West | 20mm | EDSM Provisional DR, USFWS Lodi |
| 2026-03-30 09:34:06 | Longfin Smelt | None | 2 | 14.1 | Larva | Grizzly Bay | Suisun Marsh | West | 20mm | EDSM Provisional DR, USFWS Lodi |
| 2026-03-30 09:34:06 | Longfin Smelt | None | 1 | 14.5 | Larva | Grizzly Bay | Suisun Marsh | West | 20mm | EDSM Provisional DR, USFWS Lodi |
| 2026-03-30 09:34:06 | Longfin Smelt | None | 1 | 14.6 | Larva | Grizzly Bay | Suisun Marsh | West | 20mm | EDSM Provisional DR, USFWS Lodi |
| 2026-03-30 09:34:06 | Longfin Smelt | None | 1 | 14.7 | Larva | Grizzly Bay | Suisun Marsh | West | 20mm | EDSM Provisional DR, USFWS Lodi |
| 2026-03-30 09:34:06 | Longfin Smelt | None | 1 | 15 | Larva | Grizzly Bay | Suisun Marsh | West | 20mm | EDSM Provisional DR, USFWS Lodi |
| 2026-03-30 09:34:06 | Longfin Smelt | None | 1 | 15.2 | Larva | Grizzly Bay | Suisun Marsh | West | 20mm | EDSM Provisional DR, USFWS Lodi |
| 2026-03-30 09:34:06 | Longfin Smelt | None | 2 | 15.5 | Larva | Grizzly Bay | Suisun Marsh | West | 20mm | EDSM Provisional DR, USFWS Lodi |
| 2026-03-30 09:34:06 | Longfin Smelt | None | 1 | NA | Grizzly Bay | Suisun Marsh | West | 20mm | EDSM Provisional DR, USFWS Lodi | |
| 2026-03-30 09:54:38 | Longfin Smelt | None | 1 | 7.1 | Larva | Suisun Marsh | Suisun Marsh | West | 20mm | EDSM Provisional DR, USFWS Lodi |
| 2026-03-30 09:54:38 | Longfin Smelt | None | 1 | 7.5 | Larva | Suisun Marsh | Suisun Marsh | West | 20mm | EDSM Provisional DR, USFWS Lodi |
| 2026-03-30 09:54:38 | Longfin Smelt | None | 1 | 10.5 | Larva | Suisun Marsh | Suisun Marsh | West | 20mm | EDSM Provisional DR, USFWS Lodi |
| 2026-03-30 09:54:38 | Longfin Smelt | None | 1 | 11 | Larva | Suisun Marsh | Suisun Marsh | West | 20mm | EDSM Provisional DR, USFWS Lodi |
| 2026-03-30 09:54:38 | Longfin Smelt | None | 1 | 11.2 | Larva | Suisun Marsh | Suisun Marsh | West | 20mm | EDSM Provisional DR, USFWS Lodi |
| 2026-03-30 09:54:38 | Longfin Smelt | None | 2 | 11.4 | Larva | Suisun Marsh | Suisun Marsh | West | 20mm | EDSM Provisional DR, USFWS Lodi |
| 2026-03-30 09:54:38 | Longfin Smelt | None | 1 | 11.7 | Larva | Suisun Marsh | Suisun Marsh | West | 20mm | EDSM Provisional DR, USFWS Lodi |
| 2026-03-30 09:54:38 | Longfin Smelt | None | 1 | 11.8 | Larva | Suisun Marsh | Suisun Marsh | West | 20mm | EDSM Provisional DR, USFWS Lodi |
| 2026-03-30 09:54:38 | Longfin Smelt | None | 1 | 11.9 | Larva | Suisun Marsh | Suisun Marsh | West | 20mm | EDSM Provisional DR, USFWS Lodi |
| 2026-03-30 09:54:38 | Longfin Smelt | None | 1 | 12.1 | Larva | Suisun Marsh | Suisun Marsh | West | 20mm | EDSM Provisional DR, USFWS Lodi |
| 2026-03-30 09:54:38 | Longfin Smelt | None | 1 | 12.5 | Larva | Suisun Marsh | Suisun Marsh | West | 20mm | EDSM Provisional DR, USFWS Lodi |
| 2026-03-30 09:54:38 | Longfin Smelt | None | 1 | 13.1 | Larva | Suisun Marsh | Suisun Marsh | West | 20mm | EDSM Provisional DR, USFWS Lodi |
| 2026-03-30 09:54:38 | Longfin Smelt | None | 2 | 13.2 | Larva | Suisun Marsh | Suisun Marsh | West | 20mm | EDSM Provisional DR, USFWS Lodi |
| 2026-03-30 09:54:38 | Longfin Smelt | None | 2 | 13.3 | Larva | Suisun Marsh | Suisun Marsh | West | 20mm | EDSM Provisional DR, USFWS Lodi |
| 2026-03-30 09:54:38 | Longfin Smelt | None | 1 | 13.9 | Larva | Suisun Marsh | Suisun Marsh | West | 20mm | EDSM Provisional DR, USFWS Lodi |
| 2026-03-30 09:54:38 | Longfin Smelt | None | 3 | 14 | Larva | Suisun Marsh | Suisun Marsh | West | 20mm | EDSM Provisional DR, USFWS Lodi |
| 2026-03-30 09:54:38 | Longfin Smelt | None | 1 | 14.1 | Larva | Suisun Marsh | Suisun Marsh | West | 20mm | EDSM Provisional DR, USFWS Lodi |
| 2026-03-30 09:54:38 | Longfin Smelt | None | 2 | 14.2 | Larva | Suisun Marsh | Suisun Marsh | West | 20mm | EDSM Provisional DR, USFWS Lodi |
| 2026-03-30 09:54:38 | Longfin Smelt | None | 1 | 14.3 | Larva | Suisun Marsh | Suisun Marsh | West | 20mm | EDSM Provisional DR, USFWS Lodi |
| 2026-03-30 09:54:38 | Longfin Smelt | None | 2 | 14.5 | Larva | Suisun Marsh | Suisun Marsh | West | 20mm | EDSM Provisional DR, USFWS Lodi |
| 2026-03-30 09:54:38 | Longfin Smelt | None | 2 | 15 | Larva | Suisun Marsh | Suisun Marsh | West | 20mm | EDSM Provisional DR, USFWS Lodi |
| 2026-03-30 09:54:38 | Longfin Smelt | None | 1 | 15.9 | Larva | Suisun Marsh | Suisun Marsh | West | 20mm | EDSM Provisional DR, USFWS Lodi |
| 2026-03-30 09:54:38 | Longfin Smelt | None | 1 | 16 | Larva | Suisun Marsh | Suisun Marsh | West | 20mm | EDSM Provisional DR, USFWS Lodi |
| 2026-03-30 09:54:38 | Longfin Smelt | None | 1 | 16.1 | Larva | Suisun Marsh | Suisun Marsh | West | 20mm | EDSM Provisional DR, USFWS Lodi |
| 2026-03-30 09:54:38 | Longfin Smelt | None | 1 | 16.4 | Larva | Suisun Marsh | Suisun Marsh | West | 20mm | EDSM Provisional DR, USFWS Lodi |
| 2026-03-30 09:54:38 | Longfin Smelt | None | 1 | 17.1 | Larva | Suisun Marsh | Suisun Marsh | West | 20mm | EDSM Provisional DR, USFWS Lodi |
| 2026-03-30 09:54:38 | Longfin Smelt | None | 1 | 17.2 | Larva | Suisun Marsh | Suisun Marsh | West | 20mm | EDSM Provisional DR, USFWS Lodi |
| 2026-03-30 09:54:38 | Longfin Smelt | None | 1 | 17.4 | Larva | Suisun Marsh | Suisun Marsh | West | 20mm | EDSM Provisional DR, USFWS Lodi |
| 2026-03-30 09:54:38 | Longfin Smelt | None | 1 | 18 | Larva | Suisun Marsh | Suisun Marsh | West | 20mm | EDSM Provisional DR, USFWS Lodi |
| 2026-03-30 10:10:46 | Longfin Smelt | None | 1 | 7 | Larva | Suisun Marsh | Suisun Marsh | West | 20mm | EDSM Provisional DR, USFWS Lodi |
| 2026-03-30 10:10:46 | Longfin Smelt | None | 1 | 7.2 | Larva | Suisun Marsh | Suisun Marsh | West | 20mm | EDSM Provisional DR, USFWS Lodi |
| 2026-03-30 10:10:46 | Longfin Smelt | None | 1 | 10.7 | Larva | Suisun Marsh | Suisun Marsh | West | 20mm | EDSM Provisional DR, USFWS Lodi |
| 2026-03-30 10:10:46 | Longfin Smelt | None | 1 | 10.9 | Larva | Suisun Marsh | Suisun Marsh | West | 20mm | EDSM Provisional DR, USFWS Lodi |
| 2026-03-30 10:10:46 | Longfin Smelt | None | 2 | 11.5 | Larva | Suisun Marsh | Suisun Marsh | West | 20mm | EDSM Provisional DR, USFWS Lodi |
| 2026-03-30 10:10:46 | Longfin Smelt | None | 1 | 12 | Larva | Suisun Marsh | Suisun Marsh | West | 20mm | EDSM Provisional DR, USFWS Lodi |
| 2026-03-30 10:10:46 | Longfin Smelt | None | 2 | 12.5 | Larva | Suisun Marsh | Suisun Marsh | West | 20mm | EDSM Provisional DR, USFWS Lodi |
| 2026-03-30 10:10:46 | Longfin Smelt | None | 3 | 13 | Larva | Suisun Marsh | Suisun Marsh | West | 20mm | EDSM Provisional DR, USFWS Lodi |
| 2026-03-30 10:10:46 | Longfin Smelt | None | 1 | 13.2 | Larva | Suisun Marsh | Suisun Marsh | West | 20mm | EDSM Provisional DR, USFWS Lodi |
| 2026-03-30 10:10:46 | Longfin Smelt | None | 1 | 13.5 | Larva | Suisun Marsh | Suisun Marsh | West | 20mm | EDSM Provisional DR, USFWS Lodi |
| 2026-03-30 10:10:46 | Longfin Smelt | None | 1 | 13.7 | Larva | Suisun Marsh | Suisun Marsh | West | 20mm | EDSM Provisional DR, USFWS Lodi |
| 2026-03-30 10:10:46 | Longfin Smelt | None | 1 | 13.8 | Larva | Suisun Marsh | Suisun Marsh | West | 20mm | EDSM Provisional DR, USFWS Lodi |
| 2026-03-30 10:10:46 | Longfin Smelt | None | 1 | 13.9 | Larva | Suisun Marsh | Suisun Marsh | West | 20mm | EDSM Provisional DR, USFWS Lodi |
| 2026-03-30 10:10:46 | Longfin Smelt | None | 1 | 14.2 | Larva | Suisun Marsh | Suisun Marsh | West | 20mm | EDSM Provisional DR, USFWS Lodi |
| 2026-03-30 10:10:46 | Longfin Smelt | None | 1 | 14.4 | Larva | Suisun Marsh | Suisun Marsh | West | 20mm | EDSM Provisional DR, USFWS Lodi |
| 2026-03-30 10:10:46 | Longfin Smelt | None | 3 | 14.5 | Larva | Suisun Marsh | Suisun Marsh | West | 20mm | EDSM Provisional DR, USFWS Lodi |
| 2026-03-30 10:10:46 | Longfin Smelt | None | 1 | 14.6 | Larva | Suisun Marsh | Suisun Marsh | West | 20mm | EDSM Provisional DR, USFWS Lodi |
| 2026-03-30 10:10:46 | Longfin Smelt | None | 2 | 14.7 | Larva | Suisun Marsh | Suisun Marsh | West | 20mm | EDSM Provisional DR, USFWS Lodi |
| 2026-03-30 10:10:46 | Longfin Smelt | None | 1 | 14.9 | Larva | Suisun Marsh | Suisun Marsh | West | 20mm | EDSM Provisional DR, USFWS Lodi |
| 2026-03-30 10:10:46 | Longfin Smelt | None | 3 | 15 | Larva | Suisun Marsh | Suisun Marsh | West | 20mm | EDSM Provisional DR, USFWS Lodi |
| 2026-03-30 10:10:46 | Longfin Smelt | None | 1 | 15.2 | Larva | Suisun Marsh | Suisun Marsh | West | 20mm | EDSM Provisional DR, USFWS Lodi |
| 2026-03-30 10:10:46 | Longfin Smelt | None | 1 | 15.4 | Larva | Suisun Marsh | Suisun Marsh | West | 20mm | EDSM Provisional DR, USFWS Lodi |
| 2026-03-30 10:10:46 | Longfin Smelt | None | 1 | 15.5 | Larva | Suisun Marsh | Suisun Marsh | West | 20mm | EDSM Provisional DR, USFWS Lodi |
| 2026-03-30 10:10:46 | Longfin Smelt | None | 1 | 15.8 | Larva | Suisun Marsh | Suisun Marsh | West | 20mm | EDSM Provisional DR, USFWS Lodi |
| 2026-03-30 10:10:46 | Longfin Smelt | None | 1 | 16.1 | Larva | Suisun Marsh | Suisun Marsh | West | 20mm | EDSM Provisional DR, USFWS Lodi |
| 2026-03-30 10:10:46 | Longfin Smelt | None | 1 | 16.2 | Larva | Suisun Marsh | Suisun Marsh | West | 20mm | EDSM Provisional DR, USFWS Lodi |
| 2026-03-30 10:10:46 | Longfin Smelt | None | 2 | 16.5 | Larva | Suisun Marsh | Suisun Marsh | West | 20mm | EDSM Provisional DR, USFWS Lodi |
| 2026-03-30 10:10:46 | Longfin Smelt | None | 1 | 17.2 | Larva | Suisun Marsh | Suisun Marsh | West | 20mm | EDSM Provisional DR, USFWS Lodi |
| 2026-03-30 10:10:46 | Longfin Smelt | None | 1 | 17.3 | Larva | Suisun Marsh | Suisun Marsh | West | 20mm | EDSM Provisional DR, USFWS Lodi |
| 2026-03-30 10:10:46 | Longfin Smelt | None | 1 | 17.5 | Larva | Suisun Marsh | Suisun Marsh | West | 20mm | EDSM Provisional DR, USFWS Lodi |
| 2026-03-30 10:10:46 | Longfin Smelt | None | 1 | 17.8 | Larva | Suisun Marsh | Suisun Marsh | West | 20mm | EDSM Provisional DR, USFWS Lodi |
| 2026-03-30 10:10:46 | Longfin Smelt | None | 1 | 18 | Larva | Suisun Marsh | Suisun Marsh | West | 20mm | EDSM Provisional DR, USFWS Lodi |
| 2026-03-30 10:10:46 | Longfin Smelt | None | 1 | 18.2 | Larva | Suisun Marsh | Suisun Marsh | West | 20mm | EDSM Provisional DR, USFWS Lodi |
| 2026-03-30 10:10:46 | Longfin Smelt | None | 1 | 19.9 | Larva | Suisun Marsh | Suisun Marsh | West | 20mm | EDSM Provisional DR, USFWS Lodi |
| 2026-03-30 10:10:46 | Longfin Smelt | None | 1 | 20.1 | Juvenile | Suisun Marsh | Suisun Marsh | West | 20mm | EDSM Provisional DR, USFWS Lodi |
| 2026-03-30 10:10:46 | Longfin Smelt | None | 1 | 20.4 | Juvenile | Suisun Marsh | Suisun Marsh | West | 20mm | EDSM Provisional DR, USFWS Lodi |
| 2026-03-30 10:10:46 | Longfin Smelt | None | 1 | 20.5 | Juvenile | Suisun Marsh | Suisun Marsh | West | 20mm | EDSM Provisional DR, USFWS Lodi |
| 2026-03-30 10:10:46 | Longfin Smelt | None | 1 | 20.6 | Juvenile | Suisun Marsh | Suisun Marsh | West | 20mm | EDSM Provisional DR, USFWS Lodi |
| 2026-03-30 10:10:46 | Longfin Smelt | None | 1 | 22.5 | Juvenile | Suisun Marsh | Suisun Marsh | West | 20mm | EDSM Provisional DR, USFWS Lodi |
| 2026-03-30 10:39:47 | Longfin Smelt | None | 3 | 9 | Larva | Suisun Marsh | Suisun Marsh | West | 20mm | EDSM Provisional DR, USFWS Lodi |
| 2026-03-30 10:39:47 | Longfin Smelt | None | 1 | 9.5 | Larva | Suisun Marsh | Suisun Marsh | West | 20mm | EDSM Provisional DR, USFWS Lodi |
| 2026-03-30 10:39:47 | Longfin Smelt | None | 1 | 12 | Larva | Suisun Marsh | Suisun Marsh | West | 20mm | EDSM Provisional DR, USFWS Lodi |
| 2026-03-30 10:39:47 | Longfin Smelt | None | 1 | 13.2 | Larva | Suisun Marsh | Suisun Marsh | West | 20mm | EDSM Provisional DR, USFWS Lodi |
| 2026-03-30 10:39:47 | Longfin Smelt | None | 1 | 14.3 | Larva | Suisun Marsh | Suisun Marsh | West | 20mm | EDSM Provisional DR, USFWS Lodi |
| 2026-03-30 10:39:47 | Longfin Smelt | None | 1 | 14.5 | Larva | Suisun Marsh | Suisun Marsh | West | 20mm | EDSM Provisional DR, USFWS Lodi |
| 2026-03-30 10:39:47 | Longfin Smelt | None | 1 | 15 | Larva | Suisun Marsh | Suisun Marsh | West | 20mm | EDSM Provisional DR, USFWS Lodi |
| 2026-03-30 10:39:47 | Longfin Smelt | None | 1 | 15.3 | Larva | Suisun Marsh | Suisun Marsh | West | 20mm | EDSM Provisional DR, USFWS Lodi |
| 2026-03-30 10:39:47 | Longfin Smelt | None | 1 | 15.5 | Larva | Suisun Marsh | Suisun Marsh | West | 20mm | EDSM Provisional DR, USFWS Lodi |
| 2026-03-30 10:39:47 | Longfin Smelt | None | 2 | 16.5 | Larva | Suisun Marsh | Suisun Marsh | West | 20mm | EDSM Provisional DR, USFWS Lodi |
| 2026-03-30 10:39:47 | Longfin Smelt | None | 2 | 17 | Larva | Suisun Marsh | Suisun Marsh | West | 20mm | EDSM Provisional DR, USFWS Lodi |
| 2026-03-30 10:39:47 | Longfin Smelt | None | 2 | 17.2 | Larva | Suisun Marsh | Suisun Marsh | West | 20mm | EDSM Provisional DR, USFWS Lodi |
| 2026-03-30 10:39:47 | Longfin Smelt | None | 1 | 17.3 | Larva | Suisun Marsh | Suisun Marsh | West | 20mm | EDSM Provisional DR, USFWS Lodi |
| 2026-03-30 10:39:47 | Longfin Smelt | None | 2 | 17.5 | Larva | Suisun Marsh | Suisun Marsh | West | 20mm | EDSM Provisional DR, USFWS Lodi |
| 2026-03-30 10:39:47 | Longfin Smelt | None | 5 | 18 | Larva | Suisun Marsh | Suisun Marsh | West | 20mm | EDSM Provisional DR, USFWS Lodi |
| 2026-03-30 10:39:47 | Longfin Smelt | None | 1 | 18.2 | Larva | Suisun Marsh | Suisun Marsh | West | 20mm | EDSM Provisional DR, USFWS Lodi |
| 2026-03-30 10:39:47 | Longfin Smelt | None | 2 | 18.5 | Larva | Suisun Marsh | Suisun Marsh | West | 20mm | EDSM Provisional DR, USFWS Lodi |
| 2026-03-30 10:39:47 | Longfin Smelt | None | 1 | 18.8 | Larva | Suisun Marsh | Suisun Marsh | West | 20mm | EDSM Provisional DR, USFWS Lodi |
| 2026-03-30 10:39:47 | Longfin Smelt | None | 5 | 19 | Larva | Suisun Marsh | Suisun Marsh | West | 20mm | EDSM Provisional DR, USFWS Lodi |
| 2026-03-30 10:39:47 | Longfin Smelt | None | 1 | 19.2 | Larva | Suisun Marsh | Suisun Marsh | West | 20mm | EDSM Provisional DR, USFWS Lodi |
| 2026-03-30 10:39:47 | Longfin Smelt | None | 1 | 19.5 | Larva | Suisun Marsh | Suisun Marsh | West | 20mm | EDSM Provisional DR, USFWS Lodi |
| 2026-03-30 10:39:47 | Longfin Smelt | None | 2 | 20 | Juvenile | Suisun Marsh | Suisun Marsh | West | 20mm | EDSM Provisional DR, USFWS Lodi |
| 2026-03-30 10:39:47 | Longfin Smelt | None | 5 | 20.5 | Juvenile | Suisun Marsh | Suisun Marsh | West | 20mm | EDSM Provisional DR, USFWS Lodi |
| 2026-03-30 10:39:47 | Longfin Smelt | None | 1 | 21 | Juvenile | Suisun Marsh | Suisun Marsh | West | 20mm | EDSM Provisional DR, USFWS Lodi |
| 2026-03-30 10:39:47 | Longfin Smelt | None | 1 | 21.3 | Juvenile | Suisun Marsh | Suisun Marsh | West | 20mm | EDSM Provisional DR, USFWS Lodi |
| 2026-03-30 10:39:47 | Longfin Smelt | None | 1 | 21.8 | Juvenile | Suisun Marsh | Suisun Marsh | West | 20mm | EDSM Provisional DR, USFWS Lodi |
| 2026-03-30 10:39:47 | Longfin Smelt | None | 1 | 22.5 | Juvenile | Suisun Marsh | Suisun Marsh | West | 20mm | EDSM Provisional DR, USFWS Lodi |
| 2026-03-30 10:39:47 | Longfin Smelt | None | 1 | 23 | Juvenile | Suisun Marsh | Suisun Marsh | West | 20mm | EDSM Provisional DR, USFWS Lodi |
| 2026-03-30 10:39:47 | Longfin Smelt | None | 1 | 23.2 | Juvenile | Suisun Marsh | Suisun Marsh | West | 20mm | EDSM Provisional DR, USFWS Lodi |
| 2026-03-30 10:39:47 | Longfin Smelt | None | 2 | 24 | Juvenile | Suisun Marsh | Suisun Marsh | West | 20mm | EDSM Provisional DR, USFWS Lodi |
| 2026-03-30 10:39:47 | Longfin Smelt | None | 185 | NA | Suisun Marsh | Suisun Marsh | West | 20mm | EDSM Provisional DR, USFWS Lodi | |
| 2026-03-30 10:57:49 | Longfin Smelt | None | 1 | 15.1 | Larva | Suisun Marsh | Suisun Marsh | West | 20mm | EDSM Provisional DR, USFWS Lodi |
| 2026-03-30 10:57:49 | Longfin Smelt | None | 1 | 16.7 | Larva | Suisun Marsh | Suisun Marsh | West | 20mm | EDSM Provisional DR, USFWS Lodi |
| 2026-03-30 10:57:49 | Longfin Smelt | None | 3 | 18 | Larva | Suisun Marsh | Suisun Marsh | West | 20mm | EDSM Provisional DR, USFWS Lodi |
| 2026-03-30 10:57:49 | Longfin Smelt | None | 1 | 18.7 | Larva | Suisun Marsh | Suisun Marsh | West | 20mm | EDSM Provisional DR, USFWS Lodi |
| 2026-03-30 10:57:49 | Longfin Smelt | None | 2 | 19 | Larva | Suisun Marsh | Suisun Marsh | West | 20mm | EDSM Provisional DR, USFWS Lodi |
| 2026-03-30 10:57:49 | Longfin Smelt | None | 1 | 19.8 | Larva | Suisun Marsh | Suisun Marsh | West | 20mm | EDSM Provisional DR, USFWS Lodi |
| 2026-03-30 10:57:49 | Longfin Smelt | None | 1 | 19.9 | Larva | Suisun Marsh | Suisun Marsh | West | 20mm | EDSM Provisional DR, USFWS Lodi |
| 2026-03-30 10:57:49 | Longfin Smelt | None | 1 | 20 | Juvenile | Suisun Marsh | Suisun Marsh | West | 20mm | EDSM Provisional DR, USFWS Lodi |
| 2026-03-30 10:57:49 | Longfin Smelt | None | 1 | 20.1 | Juvenile | Suisun Marsh | Suisun Marsh | West | 20mm | EDSM Provisional DR, USFWS Lodi |
| 2026-03-30 10:57:49 | Longfin Smelt | None | 1 | 20.5 | Juvenile | Suisun Marsh | Suisun Marsh | West | 20mm | EDSM Provisional DR, USFWS Lodi |
| 2026-03-30 10:57:49 | Longfin Smelt | None | 1 | 22 | Juvenile | Suisun Marsh | Suisun Marsh | West | 20mm | EDSM Provisional DR, USFWS Lodi |
| 2026-03-30 10:57:49 | Longfin Smelt | None | 1 | 36 | Juvenile | Suisun Marsh | Suisun Marsh | West | 20mm | EDSM Provisional DR, USFWS Lodi |
| 2026-03-30 10:57:49 | Longfin Smelt | None | 2 | NA | Suisun Marsh | Suisun Marsh | West | 20mm | EDSM Provisional DR, USFWS Lodi | |
| 2026-03-30 12:49:50 | Longfin Smelt | None | 1 | 6 | Larva | Suisun Marsh | Suisun Marsh | West | 20mm | EDSM Provisional DR, USFWS Lodi |
| 2026-03-30 12:49:50 | Longfin Smelt | None | 1 | 7 | Larva | Suisun Marsh | Suisun Marsh | West | 20mm | EDSM Provisional DR, USFWS Lodi |
| 2026-03-30 12:49:50 | Longfin Smelt | None | 1 | 7.8 | Larva | Suisun Marsh | Suisun Marsh | West | 20mm | EDSM Provisional DR, USFWS Lodi |
| 2026-03-30 12:49:50 | Longfin Smelt | None | 1 | 8.1 | Larva | Suisun Marsh | Suisun Marsh | West | 20mm | EDSM Provisional DR, USFWS Lodi |
| 2026-03-30 12:49:50 | Longfin Smelt | None | 1 | 8.4 | Larva | Suisun Marsh | Suisun Marsh | West | 20mm | EDSM Provisional DR, USFWS Lodi |
| 2026-03-30 12:49:50 | Longfin Smelt | None | 1 | 8.5 | Larva | Suisun Marsh | Suisun Marsh | West | 20mm | EDSM Provisional DR, USFWS Lodi |
| 2026-03-30 12:49:50 | Longfin Smelt | None | 1 | 8.6 | Larva | Suisun Marsh | Suisun Marsh | West | 20mm | EDSM Provisional DR, USFWS Lodi |
| 2026-03-30 12:49:50 | Longfin Smelt | None | 1 | 9.2 | Larva | Suisun Marsh | Suisun Marsh | West | 20mm | EDSM Provisional DR, USFWS Lodi |
| 2026-03-30 12:49:50 | Longfin Smelt | None | 1 | 9.3 | Larva | Suisun Marsh | Suisun Marsh | West | 20mm | EDSM Provisional DR, USFWS Lodi |
| 2026-03-30 12:49:50 | Longfin Smelt | None | 1 | 9.9 | Larva | Suisun Marsh | Suisun Marsh | West | 20mm | EDSM Provisional DR, USFWS Lodi |
| 2026-03-30 12:49:50 | Longfin Smelt | None | 1 | 10.1 | Larva | Suisun Marsh | Suisun Marsh | West | 20mm | EDSM Provisional DR, USFWS Lodi |
| 2026-03-30 12:49:50 | Longfin Smelt | None | 1 | 10.2 | Larva | Suisun Marsh | Suisun Marsh | West | 20mm | EDSM Provisional DR, USFWS Lodi |
| 2026-03-30 12:49:50 | Longfin Smelt | None | 1 | 10.5 | Larva | Suisun Marsh | Suisun Marsh | West | 20mm | EDSM Provisional DR, USFWS Lodi |
| 2026-03-30 12:49:50 | Longfin Smelt | None | 2 | 11.1 | Larva | Suisun Marsh | Suisun Marsh | West | 20mm | EDSM Provisional DR, USFWS Lodi |
| 2026-03-30 12:49:50 | Longfin Smelt | None | 1 | 11.8 | Larva | Suisun Marsh | Suisun Marsh | West | 20mm | EDSM Provisional DR, USFWS Lodi |
| 2026-03-30 12:49:50 | Longfin Smelt | None | 3 | 12 | Larva | Suisun Marsh | Suisun Marsh | West | 20mm | EDSM Provisional DR, USFWS Lodi |
| 2026-03-30 12:49:50 | Longfin Smelt | None | 1 | 12.2 | Larva | Suisun Marsh | Suisun Marsh | West | 20mm | EDSM Provisional DR, USFWS Lodi |
| 2026-03-30 12:49:50 | Longfin Smelt | None | 1 | 12.4 | Larva | Suisun Marsh | Suisun Marsh | West | 20mm | EDSM Provisional DR, USFWS Lodi |
| 2026-03-30 12:49:50 | Longfin Smelt | None | 2 | 12.5 | Larva | Suisun Marsh | Suisun Marsh | West | 20mm | EDSM Provisional DR, USFWS Lodi |
| 2026-03-30 12:49:50 | Longfin Smelt | None | 1 | 12.6 | Larva | Suisun Marsh | Suisun Marsh | West | 20mm | EDSM Provisional DR, USFWS Lodi |
| 2026-03-30 12:49:50 | Longfin Smelt | None | 1 | 12.7 | Larva | Suisun Marsh | Suisun Marsh | West | 20mm | EDSM Provisional DR, USFWS Lodi |
| 2026-03-30 12:49:50 | Longfin Smelt | None | 1 | 13.3 | Larva | Suisun Marsh | Suisun Marsh | West | 20mm | EDSM Provisional DR, USFWS Lodi |
| 2026-03-30 12:49:50 | Longfin Smelt | None | 2 | 13.4 | Larva | Suisun Marsh | Suisun Marsh | West | 20mm | EDSM Provisional DR, USFWS Lodi |
| 2026-03-30 12:49:50 | Longfin Smelt | None | 1 | 13.5 | Larva | Suisun Marsh | Suisun Marsh | West | 20mm | EDSM Provisional DR, USFWS Lodi |
| 2026-03-30 12:49:50 | Longfin Smelt | None | 1 | 13.6 | Larva | Suisun Marsh | Suisun Marsh | West | 20mm | EDSM Provisional DR, USFWS Lodi |
| 2026-03-30 12:49:50 | Longfin Smelt | None | 3 | 13.7 | Larva | Suisun Marsh | Suisun Marsh | West | 20mm | EDSM Provisional DR, USFWS Lodi |
| 2026-03-30 12:49:50 | Longfin Smelt | None | 1 | 13.9 | Larva | Suisun Marsh | Suisun Marsh | West | 20mm | EDSM Provisional DR, USFWS Lodi |
| 2026-03-30 12:49:50 | Longfin Smelt | None | 2 | 14.1 | Larva | Suisun Marsh | Suisun Marsh | West | 20mm | EDSM Provisional DR, USFWS Lodi |
| 2026-03-30 12:49:50 | Longfin Smelt | None | 1 | 14.2 | Larva | Suisun Marsh | Suisun Marsh | West | 20mm | EDSM Provisional DR, USFWS Lodi |
| 2026-03-30 12:49:50 | Longfin Smelt | None | 1 | 14.7 | Larva | Suisun Marsh | Suisun Marsh | West | 20mm | EDSM Provisional DR, USFWS Lodi |
| 2026-03-30 12:49:50 | Longfin Smelt | None | 1 | 15.2 | Larva | Suisun Marsh | Suisun Marsh | West | 20mm | EDSM Provisional DR, USFWS Lodi |
| 2026-03-30 12:49:50 | Longfin Smelt | None | 1 | 15.4 | Larva | Suisun Marsh | Suisun Marsh | West | 20mm | EDSM Provisional DR, USFWS Lodi |
| 2026-03-30 12:49:50 | Longfin Smelt | None | 1 | 16 | Larva | Suisun Marsh | Suisun Marsh | West | 20mm | EDSM Provisional DR, USFWS Lodi |
| 2026-03-30 12:49:50 | Longfin Smelt | None | 1 | 16.2 | Larva | Suisun Marsh | Suisun Marsh | West | 20mm | EDSM Provisional DR, USFWS Lodi |
| 2026-03-30 12:49:50 | Longfin Smelt | None | 1 | 17.9 | Larva | Suisun Marsh | Suisun Marsh | West | 20mm | EDSM Provisional DR, USFWS Lodi |
| 2026-03-30 12:49:50 | Longfin Smelt | None | 3 | NA | Suisun Marsh | Suisun Marsh | West | 20mm | EDSM Provisional DR, USFWS Lodi | |
| 2026-03-30 13:07:18 | Longfin Smelt | None | 1 | 6.9 | Larva | Suisun Marsh | Suisun Marsh | West | 20mm | EDSM Provisional DR, USFWS Lodi |
| 2026-03-30 13:07:18 | Longfin Smelt | None | 1 | 8.9 | Larva | Suisun Marsh | Suisun Marsh | West | 20mm | EDSM Provisional DR, USFWS Lodi |
| 2026-03-30 13:07:18 | Longfin Smelt | None | 2 | 9.2 | Larva | Suisun Marsh | Suisun Marsh | West | 20mm | EDSM Provisional DR, USFWS Lodi |
| 2026-03-30 13:07:18 | Longfin Smelt | None | 1 | 10.4 | Larva | Suisun Marsh | Suisun Marsh | West | 20mm | EDSM Provisional DR, USFWS Lodi |
| 2026-03-30 13:07:18 | Longfin Smelt | None | 1 | 10.8 | Larva | Suisun Marsh | Suisun Marsh | West | 20mm | EDSM Provisional DR, USFWS Lodi |
| 2026-03-30 13:07:18 | Longfin Smelt | None | 1 | 11 | Larva | Suisun Marsh | Suisun Marsh | West | 20mm | EDSM Provisional DR, USFWS Lodi |
| 2026-03-30 13:07:18 | Longfin Smelt | None | 1 | 11.1 | Larva | Suisun Marsh | Suisun Marsh | West | 20mm | EDSM Provisional DR, USFWS Lodi |
| 2026-03-30 13:07:18 | Longfin Smelt | None | 1 | 11.2 | Larva | Suisun Marsh | Suisun Marsh | West | 20mm | EDSM Provisional DR, USFWS Lodi |
| 2026-03-30 13:07:18 | Longfin Smelt | None | 1 | 11.6 | Larva | Suisun Marsh | Suisun Marsh | West | 20mm | EDSM Provisional DR, USFWS Lodi |
| 2026-03-30 13:07:18 | Longfin Smelt | None | 1 | 12.1 | Larva | Suisun Marsh | Suisun Marsh | West | 20mm | EDSM Provisional DR, USFWS Lodi |
| 2026-03-30 13:07:18 | Longfin Smelt | None | 1 | 12.2 | Larva | Suisun Marsh | Suisun Marsh | West | 20mm | EDSM Provisional DR, USFWS Lodi |
| 2026-03-30 13:07:18 | Longfin Smelt | None | 1 | 12.4 | Larva | Suisun Marsh | Suisun Marsh | West | 20mm | EDSM Provisional DR, USFWS Lodi |
| 2026-03-30 13:07:18 | Longfin Smelt | None | 1 | 12.5 | Larva | Suisun Marsh | Suisun Marsh | West | 20mm | EDSM Provisional DR, USFWS Lodi |
| 2026-03-30 13:07:18 | Longfin Smelt | None | 1 | 12.8 | Larva | Suisun Marsh | Suisun Marsh | West | 20mm | EDSM Provisional DR, USFWS Lodi |
| 2026-03-30 13:07:18 | Longfin Smelt | None | 1 | 12.9 | Larva | Suisun Marsh | Suisun Marsh | West | 20mm | EDSM Provisional DR, USFWS Lodi |
| 2026-03-30 13:07:18 | Longfin Smelt | None | 1 | 13.1 | Larva | Suisun Marsh | Suisun Marsh | West | 20mm | EDSM Provisional DR, USFWS Lodi |
| 2026-03-30 13:07:18 | Longfin Smelt | None | 1 | 13.8 | Larva | Suisun Marsh | Suisun Marsh | West | 20mm | EDSM Provisional DR, USFWS Lodi |
| 2026-03-30 13:07:18 | Longfin Smelt | None | 1 | 14.9 | Larva | Suisun Marsh | Suisun Marsh | West | 20mm | EDSM Provisional DR, USFWS Lodi |
| 2026-03-30 13:07:18 | Longfin Smelt | None | 1 | 15.5 | Larva | Suisun Marsh | Suisun Marsh | West | 20mm | EDSM Provisional DR, USFWS Lodi |
| 2026-03-31 08:15:56 | Longfin Smelt | None | 1 | 9.6 | Larva | Mid Suisun Bay | Suisun Bay | West | 20mm | EDSM Provisional DR, USFWS Lodi |
| 2026-03-31 08:15:56 | Longfin Smelt | None | 1 | NA | Mid Suisun Bay | Suisun Bay | West | 20mm | EDSM Provisional DR, USFWS Lodi | |
| 2026-03-31 08:30:45 | Longfin Smelt | None | 1 | 8.5 | Larva | Mid Suisun Bay | Suisun Bay | West | 20mm | EDSM Provisional DR, USFWS Lodi |
| 2026-03-31 10:31:28 | Longfin Smelt | None | 1 | 9.5 | Larva | Mid Suisun Bay | Suisun Bay | West | 20mm | EDSM Provisional DR, USFWS Lodi |
| 2026-03-31 10:31:28 | Longfin Smelt | None | 1 | 10.5 | Larva | Mid Suisun Bay | Suisun Bay | West | 20mm | EDSM Provisional DR, USFWS Lodi |
| 2026-03-31 10:31:28 | Longfin Smelt | None | 2 | 12 | Larva | Mid Suisun Bay | Suisun Bay | West | 20mm | EDSM Provisional DR, USFWS Lodi |
| 2026-03-31 10:31:28 | Longfin Smelt | None | 2 | 13 | Larva | Mid Suisun Bay | Suisun Bay | West | 20mm | EDSM Provisional DR, USFWS Lodi |
| 2026-03-31 10:31:28 | Longfin Smelt | None | 1 | 13.5 | Larva | Mid Suisun Bay | Suisun Bay | West | 20mm | EDSM Provisional DR, USFWS Lodi |
| 2026-03-31 10:31:28 | Longfin Smelt | None | 1 | 14 | Larva | Mid Suisun Bay | Suisun Bay | West | 20mm | EDSM Provisional DR, USFWS Lodi |
| 2026-03-31 10:31:28 | Longfin Smelt | None | 2 | 14.5 | Larva | Mid Suisun Bay | Suisun Bay | West | 20mm | EDSM Provisional DR, USFWS Lodi |
| 2026-03-31 10:31:28 | Longfin Smelt | None | 2 | 15 | Larva | Mid Suisun Bay | Suisun Bay | West | 20mm | EDSM Provisional DR, USFWS Lodi |
| 2026-03-31 10:31:28 | Longfin Smelt | None | 2 | 16 | Larva | Mid Suisun Bay | Suisun Bay | West | 20mm | EDSM Provisional DR, USFWS Lodi |
| 2026-03-31 10:31:28 | Longfin Smelt | None | 1 | 16.5 | Larva | Mid Suisun Bay | Suisun Bay | West | 20mm | EDSM Provisional DR, USFWS Lodi |
| 2026-03-31 10:31:28 | Longfin Smelt | None | 1 | 17.5 | Larva | Mid Suisun Bay | Suisun Bay | West | 20mm | EDSM Provisional DR, USFWS Lodi |
| 2026-03-31 10:31:28 | Longfin Smelt | None | 1 | 19.5 | Larva | Mid Suisun Bay | Suisun Bay | West | 20mm | EDSM Provisional DR, USFWS Lodi |
| 2026-03-31 10:48:00 | Longfin Smelt | None | 1 | 14.5 | Larva | Mid Suisun Bay | Suisun Bay | West | 20mm | EDSM Provisional DR, USFWS Lodi |
| 2026-03-31 11:28:17 | Longfin Smelt | None | 1 | 11.2 | Larva | Confluence | Suisun Bay | West | 20mm | EDSM Provisional DR, USFWS Lodi |
| 2026-03-31 11:28:17 | Longfin Smelt | None | 2 | 13.1 | Larva | Confluence | Suisun Bay | West | 20mm | EDSM Provisional DR, USFWS Lodi |
| 2026-03-31 11:28:17 | Longfin Smelt | None | 1 | 14.1 | Larva | Confluence | Suisun Bay | West | 20mm | EDSM Provisional DR, USFWS Lodi |
| 2026-03-31 11:28:17 | Longfin Smelt | None | 1 | 14.2 | Larva | Confluence | Suisun Bay | West | 20mm | EDSM Provisional DR, USFWS Lodi |
| 2026-03-31 11:45:26 | Longfin Smelt | None | 1 | 8 | Larva | Confluence | Suisun Bay | West | 20mm | EDSM Provisional DR, USFWS Lodi |
| 2026-04-02 10:05:13 | Longfin Smelt | None | 1 | 8.6 | Larva | Lower San Joaquin River | Lower San Joaquin | West | 20mm | EDSM Provisional DR, USFWS Lodi |
| 2026-04-02 10:05:13 | Longfin Smelt | None | 1 | 9.9 | Larva | Lower San Joaquin River | Lower San Joaquin | West | 20mm | EDSM Provisional DR, USFWS Lodi |
| 2026-04-06 10:37:03 | Longfin Smelt | None | 1 | 14 | Larva | Sacramento River near Rio Vista | Lower Sacramento | North | 20mm | EDSM Provisional DR, USFWS Lodi |
| 2026-04-08 09:39:40 | Longfin Smelt | None | 1 | 10.7 | Larva | Grizzly Bay | Suisun Marsh | West | 20mm | EDSM Provisional DR, USFWS Lodi |
| 2026-04-08 09:39:40 | Longfin Smelt | None | 1 | 16.1 | Larva | Grizzly Bay | Suisun Marsh | West | 20mm | EDSM Provisional DR, USFWS Lodi |
| 2026-04-08 09:39:40 | Longfin Smelt | None | 1 | 16.4 | Larva | Grizzly Bay | Suisun Marsh | West | 20mm | EDSM Provisional DR, USFWS Lodi |
| 2026-04-08 09:39:40 | Longfin Smelt | None | 2 | 17 | Larva | Grizzly Bay | Suisun Marsh | West | 20mm | EDSM Provisional DR, USFWS Lodi |
| 2026-04-08 09:39:40 | Longfin Smelt | None | 1 | 17.5 | Larva | Grizzly Bay | Suisun Marsh | West | 20mm | EDSM Provisional DR, USFWS Lodi |
| 2026-04-08 09:39:40 | Longfin Smelt | None | 1 | 19.9 | Larva | Grizzly Bay | Suisun Marsh | West | 20mm | EDSM Provisional DR, USFWS Lodi |
| 2026-04-08 09:55:15 | Longfin Smelt | None | 1 | 15.2 | Larva | Grizzly Bay | Suisun Marsh | West | 20mm | EDSM Provisional DR, USFWS Lodi |
| 2026-04-08 09:55:15 | Longfin Smelt | None | 1 | 19 | Larva | Grizzly Bay | Suisun Marsh | West | 20mm | EDSM Provisional DR, USFWS Lodi |
| 2026-04-08 09:55:15 | Longfin Smelt | None | 1 | 21.7 | Juvenile | Grizzly Bay | Suisun Marsh | West | 20mm | EDSM Provisional DR, USFWS Lodi |
| 2026-04-08 10:18:00 | Longfin Smelt | None | 1 | 5.5 | Larva | Suisun Marsh | Suisun Marsh | West | 20mm | EDSM Provisional DR, USFWS Lodi |
| 2026-04-08 10:18:00 | Longfin Smelt | None | 1 | 17.3 | Larva | Suisun Marsh | Suisun Marsh | West | 20mm | EDSM Provisional DR, USFWS Lodi |
| 2026-04-08 10:34:40 | Longfin Smelt | None | 1 | 7.7 | Larva | Suisun Marsh | Suisun Marsh | West | 20mm | EDSM Provisional DR, USFWS Lodi |
| 2026-04-08 10:34:40 | Longfin Smelt | None | 1 | 10.9 | Larva | Suisun Marsh | Suisun Marsh | West | 20mm | EDSM Provisional DR, USFWS Lodi |
| 2026-04-08 10:34:40 | Longfin Smelt | None | 1 | 11.2 | Larva | Suisun Marsh | Suisun Marsh | West | 20mm | EDSM Provisional DR, USFWS Lodi |
| 2026-04-08 10:34:40 | Longfin Smelt | None | 1 | 14.3 | Larva | Suisun Marsh | Suisun Marsh | West | 20mm | EDSM Provisional DR, USFWS Lodi |
| 2026-04-08 10:34:40 | Longfin Smelt | None | 1 | 14.5 | Larva | Suisun Marsh | Suisun Marsh | West | 20mm | EDSM Provisional DR, USFWS Lodi |
| 2026-04-08 10:34:40 | Longfin Smelt | None | 1 | 15.3 | Larva | Suisun Marsh | Suisun Marsh | West | 20mm | EDSM Provisional DR, USFWS Lodi |
| 2026-04-08 10:34:40 | Longfin Smelt | None | 1 | 15.7 | Larva | Suisun Marsh | Suisun Marsh | West | 20mm | EDSM Provisional DR, USFWS Lodi |
| 2026-04-08 10:34:40 | Longfin Smelt | None | 1 | 17.6 | Larva | Suisun Marsh | Suisun Marsh | West | 20mm | EDSM Provisional DR, USFWS Lodi |
| 2026-04-08 10:34:40 | Longfin Smelt | None | 1 | 18.2 | Larva | Suisun Marsh | Suisun Marsh | West | 20mm | EDSM Provisional DR, USFWS Lodi |
| 2026-04-08 10:34:40 | Longfin Smelt | None | 1 | 18.5 | Larva | Suisun Marsh | Suisun Marsh | West | 20mm | EDSM Provisional DR, USFWS Lodi |
| 2026-04-08 10:34:40 | Longfin Smelt | None | 1 | 19.3 | Larva | Suisun Marsh | Suisun Marsh | West | 20mm | EDSM Provisional DR, USFWS Lodi |
| 2026-04-08 10:34:40 | Longfin Smelt | None | 1 | 20.4 | Juvenile | Suisun Marsh | Suisun Marsh | West | 20mm | EDSM Provisional DR, USFWS Lodi |
| 2026-04-08 10:34:40 | Longfin Smelt | None | 1 | 23.2 | Juvenile | Suisun Marsh | Suisun Marsh | West | 20mm | EDSM Provisional DR, USFWS Lodi |
| 2026-04-08 10:34:40 | Longfin Smelt | None | 1 | NA | Suisun Marsh | Suisun Marsh | West | 20mm | EDSM Provisional DR, USFWS Lodi | |
| 2026-04-08 11:07:57 | Longfin Smelt | None | 1 | 14.6 | Larva | Suisun Marsh | Suisun Marsh | West | 20mm | EDSM Provisional DR, USFWS Lodi |
| 2026-04-08 11:07:57 | Longfin Smelt | None | 1 | 16.2 | Larva | Suisun Marsh | Suisun Marsh | West | 20mm | EDSM Provisional DR, USFWS Lodi |
| 2026-04-08 11:07:57 | Longfin Smelt | None | 3 | 16.8 | Larva | Suisun Marsh | Suisun Marsh | West | 20mm | EDSM Provisional DR, USFWS Lodi |
| 2026-04-08 11:07:57 | Longfin Smelt | None | 1 | 17.3 | Larva | Suisun Marsh | Suisun Marsh | West | 20mm | EDSM Provisional DR, USFWS Lodi |
| 2026-04-08 11:07:57 | Longfin Smelt | None | 1 | 17.6 | Larva | Suisun Marsh | Suisun Marsh | West | 20mm | EDSM Provisional DR, USFWS Lodi |
| 2026-04-08 11:07:57 | Longfin Smelt | None | 1 | 18.1 | Larva | Suisun Marsh | Suisun Marsh | West | 20mm | EDSM Provisional DR, USFWS Lodi |
| 2026-04-08 11:07:57 | Longfin Smelt | None | 1 | 18.8 | Larva | Suisun Marsh | Suisun Marsh | West | 20mm | EDSM Provisional DR, USFWS Lodi |
| 2026-04-08 11:07:57 | Longfin Smelt | None | 1 | 20.4 | Juvenile | Suisun Marsh | Suisun Marsh | West | 20mm | EDSM Provisional DR, USFWS Lodi |
| 2026-04-08 11:07:57 | Longfin Smelt | None | 1 | 20.6 | Juvenile | Suisun Marsh | Suisun Marsh | West | 20mm | EDSM Provisional DR, USFWS Lodi |
| 2026-04-08 11:07:57 | Longfin Smelt | None | 1 | 21.3 | Juvenile | Suisun Marsh | Suisun Marsh | West | 20mm | EDSM Provisional DR, USFWS Lodi |
| 2026-04-08 11:24:41 | Longfin Smelt | None | 1 | 15 | Larva | Suisun Marsh | Suisun Marsh | West | 20mm | EDSM Provisional DR, USFWS Lodi |
| 2026-04-08 11:24:41 | Longfin Smelt | None | 1 | 16 | Larva | Suisun Marsh | Suisun Marsh | West | 20mm | EDSM Provisional DR, USFWS Lodi |
| 2026-04-08 11:24:41 | Longfin Smelt | None | 1 | 16.4 | Larva | Suisun Marsh | Suisun Marsh | West | 20mm | EDSM Provisional DR, USFWS Lodi |
| 2026-04-08 11:24:41 | Longfin Smelt | None | 1 | 16.6 | Larva | Suisun Marsh | Suisun Marsh | West | 20mm | EDSM Provisional DR, USFWS Lodi |
| 2026-04-08 11:24:41 | Longfin Smelt | None | 1 | 17.4 | Larva | Suisun Marsh | Suisun Marsh | West | 20mm | EDSM Provisional DR, USFWS Lodi |
| 2026-04-08 11:24:41 | Longfin Smelt | None | 1 | 17.6 | Larva | Suisun Marsh | Suisun Marsh | West | 20mm | EDSM Provisional DR, USFWS Lodi |
| 2026-04-08 11:24:41 | Longfin Smelt | None | 1 | 17.8 | Larva | Suisun Marsh | Suisun Marsh | West | 20mm | EDSM Provisional DR, USFWS Lodi |
| 2026-04-08 11:24:41 | Longfin Smelt | None | 1 | 17.9 | Larva | Suisun Marsh | Suisun Marsh | West | 20mm | EDSM Provisional DR, USFWS Lodi |
| 2026-04-08 11:24:41 | Longfin Smelt | None | 1 | 18.6 | Larva | Suisun Marsh | Suisun Marsh | West | 20mm | EDSM Provisional DR, USFWS Lodi |
| 2026-04-08 11:24:41 | Longfin Smelt | None | 1 | 19 | Larva | Suisun Marsh | Suisun Marsh | West | 20mm | EDSM Provisional DR, USFWS Lodi |
| 2026-04-08 11:24:41 | Longfin Smelt | None | 1 | 21.6 | Juvenile | Suisun Marsh | Suisun Marsh | West | 20mm | EDSM Provisional DR, USFWS Lodi |
| 2026-04-08 11:24:41 | Longfin Smelt | None | 1 | 21.8 | Juvenile | Suisun Marsh | Suisun Marsh | West | 20mm | EDSM Provisional DR, USFWS Lodi |
| 2026-04-08 11:24:41 | Longfin Smelt | None | 1 | 22.4 | Juvenile | Suisun Marsh | Suisun Marsh | West | 20mm | EDSM Provisional DR, USFWS Lodi |
| 2026-04-08 12:00:35 | Longfin Smelt | None | 1 | 10.1 | Larva | Suisun Marsh | Suisun Marsh | West | 20mm | EDSM Provisional DR, USFWS Lodi |
| 2026-04-08 12:00:35 | Longfin Smelt | None | 1 | 10.6 | Larva | Suisun Marsh | Suisun Marsh | West | 20mm | EDSM Provisional DR, USFWS Lodi |
| 2026-04-08 12:00:35 | Longfin Smelt | None | 1 | 12.3 | Larva | Suisun Marsh | Suisun Marsh | West | 20mm | EDSM Provisional DR, USFWS Lodi |
| 2026-04-08 12:00:35 | Longfin Smelt | None | 1 | 12.8 | Larva | Suisun Marsh | Suisun Marsh | West | 20mm | EDSM Provisional DR, USFWS Lodi |
| 2026-04-08 12:00:35 | Longfin Smelt | None | 1 | 13.2 | Larva | Suisun Marsh | Suisun Marsh | West | 20mm | EDSM Provisional DR, USFWS Lodi |
| 2026-04-08 12:00:35 | Longfin Smelt | None | 1 | 13.4 | Larva | Suisun Marsh | Suisun Marsh | West | 20mm | EDSM Provisional DR, USFWS Lodi |
| 2026-04-08 12:00:35 | Longfin Smelt | None | 1 | 13.9 | Larva | Suisun Marsh | Suisun Marsh | West | 20mm | EDSM Provisional DR, USFWS Lodi |
| 2026-04-08 12:00:35 | Longfin Smelt | None | 1 | 14.6 | Larva | Suisun Marsh | Suisun Marsh | West | 20mm | EDSM Provisional DR, USFWS Lodi |
| 2026-04-08 12:00:35 | Longfin Smelt | None | 1 | 15.4 | Larva | Suisun Marsh | Suisun Marsh | West | 20mm | EDSM Provisional DR, USFWS Lodi |
| 2026-04-08 12:00:35 | Longfin Smelt | None | 1 | 15.6 | Larva | Suisun Marsh | Suisun Marsh | West | 20mm | EDSM Provisional DR, USFWS Lodi |
| 2026-04-08 12:00:35 | Longfin Smelt | None | 1 | 15.8 | Larva | Suisun Marsh | Suisun Marsh | West | 20mm | EDSM Provisional DR, USFWS Lodi |
| 2026-04-08 12:00:35 | Longfin Smelt | None | 1 | 16.2 | Larva | Suisun Marsh | Suisun Marsh | West | 20mm | EDSM Provisional DR, USFWS Lodi |
| 2026-04-08 12:00:35 | Longfin Smelt | None | 1 | 16.3 | Larva | Suisun Marsh | Suisun Marsh | West | 20mm | EDSM Provisional DR, USFWS Lodi |
| 2026-04-08 12:00:35 | Longfin Smelt | None | 1 | 16.4 | Larva | Suisun Marsh | Suisun Marsh | West | 20mm | EDSM Provisional DR, USFWS Lodi |
| 2026-04-08 12:00:35 | Longfin Smelt | None | 1 | 16.6 | Larva | Suisun Marsh | Suisun Marsh | West | 20mm | EDSM Provisional DR, USFWS Lodi |
| 2026-04-08 12:00:35 | Longfin Smelt | None | 1 | 16.7 | Larva | Suisun Marsh | Suisun Marsh | West | 20mm | EDSM Provisional DR, USFWS Lodi |
| 2026-04-08 12:00:35 | Longfin Smelt | None | 2 | 17 | Larva | Suisun Marsh | Suisun Marsh | West | 20mm | EDSM Provisional DR, USFWS Lodi |
| 2026-04-08 12:00:35 | Longfin Smelt | None | 1 | 17.1 | Larva | Suisun Marsh | Suisun Marsh | West | 20mm | EDSM Provisional DR, USFWS Lodi |
| 2026-04-08 12:00:35 | Longfin Smelt | None | 2 | 17.3 | Larva | Suisun Marsh | Suisun Marsh | West | 20mm | EDSM Provisional DR, USFWS Lodi |
| 2026-04-08 12:00:35 | Longfin Smelt | None | 1 | 18.6 | Larva | Suisun Marsh | Suisun Marsh | West | 20mm | EDSM Provisional DR, USFWS Lodi |
| 2026-04-08 12:00:35 | Longfin Smelt | None | 1 | 19.3 | Larva | Suisun Marsh | Suisun Marsh | West | 20mm | EDSM Provisional DR, USFWS Lodi |
| 2026-04-08 12:00:35 | Longfin Smelt | None | 1 | 23.5 | Juvenile | Suisun Marsh | Suisun Marsh | West | 20mm | EDSM Provisional DR, USFWS Lodi |
| 2026-04-08 12:17:00 | Longfin Smelt | None | 2 | 9 | Larva | Suisun Marsh | Suisun Marsh | West | 20mm | EDSM Provisional DR, USFWS Lodi |
| 2026-04-08 12:17:00 | Longfin Smelt | None | 1 | 10 | Larva | Suisun Marsh | Suisun Marsh | West | 20mm | EDSM Provisional DR, USFWS Lodi |
| 2026-04-08 12:17:00 | Longfin Smelt | None | 1 | 10.5 | Larva | Suisun Marsh | Suisun Marsh | West | 20mm | EDSM Provisional DR, USFWS Lodi |
| 2026-04-08 12:17:00 | Longfin Smelt | None | 2 | 11.5 | Larva | Suisun Marsh | Suisun Marsh | West | 20mm | EDSM Provisional DR, USFWS Lodi |
| 2026-04-08 12:17:00 | Longfin Smelt | None | 1 | 12 | Larva | Suisun Marsh | Suisun Marsh | West | 20mm | EDSM Provisional DR, USFWS Lodi |
| 2026-04-08 12:17:00 | Longfin Smelt | None | 4 | 13 | Larva | Suisun Marsh | Suisun Marsh | West | 20mm | EDSM Provisional DR, USFWS Lodi |
| 2026-04-08 12:17:00 | Longfin Smelt | None | 2 | 14 | Larva | Suisun Marsh | Suisun Marsh | West | 20mm | EDSM Provisional DR, USFWS Lodi |
| 2026-04-08 12:17:00 | Longfin Smelt | None | 2 | 14.5 | Larva | Suisun Marsh | Suisun Marsh | West | 20mm | EDSM Provisional DR, USFWS Lodi |
| 2026-04-08 12:17:00 | Longfin Smelt | None | 4 | 15 | Larva | Suisun Marsh | Suisun Marsh | West | 20mm | EDSM Provisional DR, USFWS Lodi |
| 2026-04-08 12:17:00 | Longfin Smelt | None | 3 | 15.5 | Larva | Suisun Marsh | Suisun Marsh | West | 20mm | EDSM Provisional DR, USFWS Lodi |
| 2026-04-08 12:17:00 | Longfin Smelt | None | 3 | 16 | Larva | Suisun Marsh | Suisun Marsh | West | 20mm | EDSM Provisional DR, USFWS Lodi |
| 2026-04-08 12:17:00 | Longfin Smelt | None | 2 | 16.5 | Larva | Suisun Marsh | Suisun Marsh | West | 20mm | EDSM Provisional DR, USFWS Lodi |
| 2026-04-08 12:17:00 | Longfin Smelt | None | 7 | 17 | Larva | Suisun Marsh | Suisun Marsh | West | 20mm | EDSM Provisional DR, USFWS Lodi |
| 2026-04-08 12:17:00 | Longfin Smelt | None | 2 | 17.5 | Larva | Suisun Marsh | Suisun Marsh | West | 20mm | EDSM Provisional DR, USFWS Lodi |
| 2026-04-08 12:17:00 | Longfin Smelt | None | 4 | 18 | Larva | Suisun Marsh | Suisun Marsh | West | 20mm | EDSM Provisional DR, USFWS Lodi |
| 2026-04-08 12:17:00 | Longfin Smelt | None | 2 | 18.5 | Larva | Suisun Marsh | Suisun Marsh | West | 20mm | EDSM Provisional DR, USFWS Lodi |
| 2026-04-08 12:17:00 | Longfin Smelt | None | 2 | 19 | Larva | Suisun Marsh | Suisun Marsh | West | 20mm | EDSM Provisional DR, USFWS Lodi |
| 2026-04-08 12:17:00 | Longfin Smelt | None | 1 | 19.5 | Larva | Suisun Marsh | Suisun Marsh | West | 20mm | EDSM Provisional DR, USFWS Lodi |
| 2026-04-08 12:17:00 | Longfin Smelt | None | 1 | 20.5 | Juvenile | Suisun Marsh | Suisun Marsh | West | 20mm | EDSM Provisional DR, USFWS Lodi |
| 2026-04-08 12:17:00 | Longfin Smelt | None | 2 | 21.5 | Juvenile | Suisun Marsh | Suisun Marsh | West | 20mm | EDSM Provisional DR, USFWS Lodi |
| 2026-04-08 12:17:00 | Longfin Smelt | None | 1 | 23 | Juvenile | Suisun Marsh | Suisun Marsh | West | 20mm | EDSM Provisional DR, USFWS Lodi |
| 2026-04-08 12:17:00 | Longfin Smelt | None | 2 | NA | Suisun Marsh | Suisun Marsh | West | 20mm | EDSM Provisional DR, USFWS Lodi | |
| 2026-04-09 11:40:12 | Longfin Smelt | None | 1 | 11.3 | Larva | San Joaquin River at Twitchell Island | Lower San Joaquin | South | 20mm | EDSM Provisional DR, USFWS Lodi |
| 2026-04-10 09:30:44 | Longfin Smelt | None | 1 | 10.1 | Larva | Honker Bay | Suisun Bay | West | 20mm | EDSM Provisional DR, USFWS Lodi |
| 2026-04-16 11:04:42 | Longfin Smelt | None | 1 | 11.3 | Larva | Confluence | Suisun Bay | West | 20mm | EDSM Provisional DR, USFWS Lodi |
| 2026-04-16 11:04:42 | Longfin Smelt | None | 1 | 13.2 | Larva | Confluence | Suisun Bay | West | 20mm | EDSM Provisional DR, USFWS Lodi |
| 2026-04-16 11:04:42 | Longfin Smelt | None | 1 | 13.3 | Larva | Confluence | Suisun Bay | West | 20mm | EDSM Provisional DR, USFWS Lodi |
| 2026-04-16 11:22:23 | Longfin Smelt | None | 1 | 10 | Larva | Confluence | Suisun Bay | West | 20mm | EDSM Provisional DR, USFWS Lodi |
| 2026-04-17 09:16:18 | Longfin Smelt | None | 1 | 13 | Larva | Suisun Marsh | Suisun Marsh | West | 20mm | EDSM Provisional DR, USFWS Lodi |
| 2026-04-17 09:16:18 | Longfin Smelt | None | 1 | 15.3 | Larva | Suisun Marsh | Suisun Marsh | West | 20mm | EDSM Provisional DR, USFWS Lodi |
| 2026-04-17 09:16:18 | Longfin Smelt | None | 1 | 15.4 | Larva | Suisun Marsh | Suisun Marsh | West | 20mm | EDSM Provisional DR, USFWS Lodi |
| 2026-04-17 09:16:18 | Longfin Smelt | None | 1 | 17 | Larva | Suisun Marsh | Suisun Marsh | West | 20mm | EDSM Provisional DR, USFWS Lodi |
| 2026-04-17 09:16:18 | Longfin Smelt | None | 1 | 17.3 | Larva | Suisun Marsh | Suisun Marsh | West | 20mm | EDSM Provisional DR, USFWS Lodi |
| 2026-04-17 09:16:18 | Longfin Smelt | None | 1 | 17.6 | Larva | Suisun Marsh | Suisun Marsh | West | 20mm | EDSM Provisional DR, USFWS Lodi |
| 2026-04-17 09:16:18 | Longfin Smelt | None | 1 | 18.2 | Larva | Suisun Marsh | Suisun Marsh | West | 20mm | EDSM Provisional DR, USFWS Lodi |
| 2026-04-17 09:16:18 | Longfin Smelt | None | 1 | 18.5 | Larva | Suisun Marsh | Suisun Marsh | West | 20mm | EDSM Provisional DR, USFWS Lodi |
| 2026-04-17 09:16:18 | Longfin Smelt | None | 1 | 18.9 | Larva | Suisun Marsh | Suisun Marsh | West | 20mm | EDSM Provisional DR, USFWS Lodi |
| 2026-04-17 09:16:18 | Longfin Smelt | None | 1 | 19.6 | Larva | Suisun Marsh | Suisun Marsh | West | 20mm | EDSM Provisional DR, USFWS Lodi |
| 2026-04-17 09:16:18 | Longfin Smelt | None | 1 | 20.7 | Juvenile | Suisun Marsh | Suisun Marsh | West | 20mm | EDSM Provisional DR, USFWS Lodi |
| 2026-04-17 09:16:18 | Longfin Smelt | None | 1 | 21.4 | Juvenile | Suisun Marsh | Suisun Marsh | West | 20mm | EDSM Provisional DR, USFWS Lodi |
| 2026-04-17 09:16:18 | Longfin Smelt | None | 1 | 22.8 | Juvenile | Suisun Marsh | Suisun Marsh | West | 20mm | EDSM Provisional DR, USFWS Lodi |
| 2026-04-17 09:16:18 | Longfin Smelt | None | 1 | 23.4 | Juvenile | Suisun Marsh | Suisun Marsh | West | 20mm | EDSM Provisional DR, USFWS Lodi |
| 2026-04-17 09:16:18 | Longfin Smelt | None | 1 | 23.5 | Juvenile | Suisun Marsh | Suisun Marsh | West | 20mm | EDSM Provisional DR, USFWS Lodi |
| 2026-04-17 09:16:18 | Longfin Smelt | None | 2 | 24.1 | Juvenile | Suisun Marsh | Suisun Marsh | West | 20mm | EDSM Provisional DR, USFWS Lodi |
| 2026-04-17 09:16:18 | Longfin Smelt | None | 1 | 24.5 | Juvenile | Suisun Marsh | Suisun Marsh | West | 20mm | EDSM Provisional DR, USFWS Lodi |
| 2026-04-17 09:16:18 | Longfin Smelt | None | 1 | 25.3 | Juvenile | Suisun Marsh | Suisun Marsh | West | 20mm | EDSM Provisional DR, USFWS Lodi |
| 2026-04-17 09:31:28 | Longfin Smelt | None | 1 | 15.4 | Larva | Suisun Marsh | Suisun Marsh | West | 20mm | EDSM Provisional DR, USFWS Lodi |
| 2026-04-17 09:31:28 | Longfin Smelt | None | 1 | 16.6 | Larva | Suisun Marsh | Suisun Marsh | West | 20mm | EDSM Provisional DR, USFWS Lodi |
| 2026-04-17 09:31:28 | Longfin Smelt | None | 2 | 16.9 | Larva | Suisun Marsh | Suisun Marsh | West | 20mm | EDSM Provisional DR, USFWS Lodi |
| 2026-04-17 09:31:28 | Longfin Smelt | None | 2 | 17 | Larva | Suisun Marsh | Suisun Marsh | West | 20mm | EDSM Provisional DR, USFWS Lodi |
| 2026-04-17 09:31:28 | Longfin Smelt | None | 1 | 17.2 | Larva | Suisun Marsh | Suisun Marsh | West | 20mm | EDSM Provisional DR, USFWS Lodi |
| 2026-04-17 09:31:28 | Longfin Smelt | None | 1 | 17.5 | Larva | Suisun Marsh | Suisun Marsh | West | 20mm | EDSM Provisional DR, USFWS Lodi |
| 2026-04-17 09:31:28 | Longfin Smelt | None | 1 | 17.8 | Larva | Suisun Marsh | Suisun Marsh | West | 20mm | EDSM Provisional DR, USFWS Lodi |
| 2026-04-17 09:31:28 | Longfin Smelt | None | 1 | 18 | Larva | Suisun Marsh | Suisun Marsh | West | 20mm | EDSM Provisional DR, USFWS Lodi |
| 2026-04-17 09:31:28 | Longfin Smelt | None | 2 | 18.2 | Larva | Suisun Marsh | Suisun Marsh | West | 20mm | EDSM Provisional DR, USFWS Lodi |
| 2026-04-17 09:31:28 | Longfin Smelt | None | 1 | 18.3 | Larva | Suisun Marsh | Suisun Marsh | West | 20mm | EDSM Provisional DR, USFWS Lodi |
| 2026-04-17 09:31:28 | Longfin Smelt | None | 1 | 18.5 | Larva | Suisun Marsh | Suisun Marsh | West | 20mm | EDSM Provisional DR, USFWS Lodi |
| 2026-04-17 09:31:28 | Longfin Smelt | None | 1 | 19 | Larva | Suisun Marsh | Suisun Marsh | West | 20mm | EDSM Provisional DR, USFWS Lodi |
| 2026-04-17 09:31:28 | Longfin Smelt | None | 1 | 19.1 | Larva | Suisun Marsh | Suisun Marsh | West | 20mm | EDSM Provisional DR, USFWS Lodi |
| 2026-04-17 09:31:28 | Longfin Smelt | None | 1 | 19.4 | Larva | Suisun Marsh | Suisun Marsh | West | 20mm | EDSM Provisional DR, USFWS Lodi |
| 2026-04-17 09:31:28 | Longfin Smelt | None | 1 | 19.5 | Larva | Suisun Marsh | Suisun Marsh | West | 20mm | EDSM Provisional DR, USFWS Lodi |
| 2026-04-17 09:31:28 | Longfin Smelt | None | 1 | 19.9 | Larva | Suisun Marsh | Suisun Marsh | West | 20mm | EDSM Provisional DR, USFWS Lodi |
| 2026-04-17 09:31:28 | Longfin Smelt | None | 1 | 20.1 | Juvenile | Suisun Marsh | Suisun Marsh | West | 20mm | EDSM Provisional DR, USFWS Lodi |
| 2026-04-17 09:31:28 | Longfin Smelt | None | 2 | 20.4 | Juvenile | Suisun Marsh | Suisun Marsh | West | 20mm | EDSM Provisional DR, USFWS Lodi |
| 2026-04-17 09:31:28 | Longfin Smelt | None | 1 | 20.5 | Juvenile | Suisun Marsh | Suisun Marsh | West | 20mm | EDSM Provisional DR, USFWS Lodi |
| 2026-04-17 09:31:28 | Longfin Smelt | None | 1 | 20.6 | Juvenile | Suisun Marsh | Suisun Marsh | West | 20mm | EDSM Provisional DR, USFWS Lodi |
| 2026-04-17 09:31:28 | Longfin Smelt | None | 1 | 20.8 | Juvenile | Suisun Marsh | Suisun Marsh | West | 20mm | EDSM Provisional DR, USFWS Lodi |
| 2026-04-17 09:31:28 | Longfin Smelt | None | 1 | 20.9 | Juvenile | Suisun Marsh | Suisun Marsh | West | 20mm | EDSM Provisional DR, USFWS Lodi |
| 2026-04-17 09:31:28 | Longfin Smelt | None | 1 | 21.3 | Juvenile | Suisun Marsh | Suisun Marsh | West | 20mm | EDSM Provisional DR, USFWS Lodi |
| 2026-04-17 09:31:28 | Longfin Smelt | None | 1 | 21.7 | Juvenile | Suisun Marsh | Suisun Marsh | West | 20mm | EDSM Provisional DR, USFWS Lodi |
| 2026-04-17 09:31:28 | Longfin Smelt | None | 1 | 21.8 | Juvenile | Suisun Marsh | Suisun Marsh | West | 20mm | EDSM Provisional DR, USFWS Lodi |
| 2026-04-17 09:31:28 | Longfin Smelt | None | 1 | 22.5 | Juvenile | Suisun Marsh | Suisun Marsh | West | 20mm | EDSM Provisional DR, USFWS Lodi |
| 2026-04-17 09:31:28 | Longfin Smelt | None | 1 | 22.7 | Juvenile | Suisun Marsh | Suisun Marsh | West | 20mm | EDSM Provisional DR, USFWS Lodi |
| 2026-04-17 09:31:28 | Longfin Smelt | None | 1 | 23.2 | Juvenile | Suisun Marsh | Suisun Marsh | West | 20mm | EDSM Provisional DR, USFWS Lodi |
| 2026-04-17 09:31:28 | Longfin Smelt | None | 1 | 23.4 | Juvenile | Suisun Marsh | Suisun Marsh | West | 20mm | EDSM Provisional DR, USFWS Lodi |
| 2026-04-17 09:31:28 | Longfin Smelt | None | 1 | 23.5 | Juvenile | Suisun Marsh | Suisun Marsh | West | 20mm | EDSM Provisional DR, USFWS Lodi |
| 2026-04-17 09:31:28 | Longfin Smelt | None | 1 | 26.6 | Juvenile | Suisun Marsh | Suisun Marsh | West | 20mm | EDSM Provisional DR, USFWS Lodi |
| 2026-04-17 09:57:04 | Longfin Smelt | None | 2 | 13 | Larva | Suisun Marsh | Suisun Marsh | West | 20mm | EDSM Provisional DR, USFWS Lodi |
| 2026-04-17 09:57:04 | Longfin Smelt | None | 1 | 14.5 | Larva | Suisun Marsh | Suisun Marsh | West | 20mm | EDSM Provisional DR, USFWS Lodi |
| 2026-04-17 09:57:04 | Longfin Smelt | None | 3 | 16 | Larva | Suisun Marsh | Suisun Marsh | West | 20mm | EDSM Provisional DR, USFWS Lodi |
| 2026-04-17 09:57:04 | Longfin Smelt | None | 6 | 17 | Larva | Suisun Marsh | Suisun Marsh | West | 20mm | EDSM Provisional DR, USFWS Lodi |
| 2026-04-17 09:57:04 | Longfin Smelt | None | 1 | 17.5 | Larva | Suisun Marsh | Suisun Marsh | West | 20mm | EDSM Provisional DR, USFWS Lodi |
| 2026-04-17 09:57:04 | Longfin Smelt | None | 12 | 18 | Larva | Suisun Marsh | Suisun Marsh | West | 20mm | EDSM Provisional DR, USFWS Lodi |
| 2026-04-17 09:57:04 | Longfin Smelt | None | 1 | 18.5 | Larva | Suisun Marsh | Suisun Marsh | West | 20mm | EDSM Provisional DR, USFWS Lodi |
| 2026-04-17 09:57:04 | Longfin Smelt | None | 8 | 19 | Larva | Suisun Marsh | Suisun Marsh | West | 20mm | EDSM Provisional DR, USFWS Lodi |
| 2026-04-17 09:57:04 | Longfin Smelt | None | 3 | 20 | Juvenile | Suisun Marsh | Suisun Marsh | West | 20mm | EDSM Provisional DR, USFWS Lodi |
| 2026-04-17 09:57:04 | Longfin Smelt | None | 2 | 20.5 | Juvenile | Suisun Marsh | Suisun Marsh | West | 20mm | EDSM Provisional DR, USFWS Lodi |
| 2026-04-17 09:57:04 | Longfin Smelt | None | 1 | 20.8 | Juvenile | Suisun Marsh | Suisun Marsh | West | 20mm | EDSM Provisional DR, USFWS Lodi |
| 2026-04-17 09:57:04 | Longfin Smelt | None | 3 | 21 | Juvenile | Suisun Marsh | Suisun Marsh | West | 20mm | EDSM Provisional DR, USFWS Lodi |
| 2026-04-17 09:57:04 | Longfin Smelt | None | 3 | 21.5 | Juvenile | Suisun Marsh | Suisun Marsh | West | 20mm | EDSM Provisional DR, USFWS Lodi |
| 2026-04-17 09:57:04 | Longfin Smelt | None | 1 | 22 | Juvenile | Suisun Marsh | Suisun Marsh | West | 20mm | EDSM Provisional DR, USFWS Lodi |
| 2026-04-17 09:57:04 | Longfin Smelt | None | 2 | 23 | Juvenile | Suisun Marsh | Suisun Marsh | West | 20mm | EDSM Provisional DR, USFWS Lodi |
| 2026-04-17 09:57:04 | Longfin Smelt | None | 1 | 24 | Juvenile | Suisun Marsh | Suisun Marsh | West | 20mm | EDSM Provisional DR, USFWS Lodi |
| 2026-04-17 09:57:04 | Longfin Smelt | None | 1 | 25 | Juvenile | Suisun Marsh | Suisun Marsh | West | 20mm | EDSM Provisional DR, USFWS Lodi |
| 2026-04-17 09:57:04 | Longfin Smelt | None | 41 | NA | Suisun Marsh | Suisun Marsh | West | 20mm | EDSM Provisional DR, USFWS Lodi | |
| 2026-04-17 10:14:36 | Longfin Smelt | None | 1 | 14 | Larva | Suisun Marsh | Suisun Marsh | West | 20mm | EDSM Provisional DR, USFWS Lodi |
| 2026-04-17 10:14:36 | Longfin Smelt | None | 2 | 14.5 | Larva | Suisun Marsh | Suisun Marsh | West | 20mm | EDSM Provisional DR, USFWS Lodi |
| 2026-04-17 10:14:36 | Longfin Smelt | None | 3 | 15 | Larva | Suisun Marsh | Suisun Marsh | West | 20mm | EDSM Provisional DR, USFWS Lodi |
| 2026-04-17 10:14:36 | Longfin Smelt | None | 1 | 15.2 | Larva | Suisun Marsh | Suisun Marsh | West | 20mm | EDSM Provisional DR, USFWS Lodi |
| 2026-04-17 10:14:36 | Longfin Smelt | None | 4 | 16 | Larva | Suisun Marsh | Suisun Marsh | West | 20mm | EDSM Provisional DR, USFWS Lodi |
| 2026-04-17 10:14:36 | Longfin Smelt | None | 6 | 17 | Larva | Suisun Marsh | Suisun Marsh | West | 20mm | EDSM Provisional DR, USFWS Lodi |
| 2026-04-17 10:14:36 | Longfin Smelt | None | 2 | 17.5 | Larva | Suisun Marsh | Suisun Marsh | West | 20mm | EDSM Provisional DR, USFWS Lodi |
| 2026-04-17 10:14:36 | Longfin Smelt | None | 6 | 18 | Larva | Suisun Marsh | Suisun Marsh | West | 20mm | EDSM Provisional DR, USFWS Lodi |
| 2026-04-17 10:14:36 | Longfin Smelt | None | 1 | 18.1 | Larva | Suisun Marsh | Suisun Marsh | West | 20mm | EDSM Provisional DR, USFWS Lodi |
| 2026-04-17 10:14:36 | Longfin Smelt | None | 3 | 18.2 | Larva | Suisun Marsh | Suisun Marsh | West | 20mm | EDSM Provisional DR, USFWS Lodi |
| 2026-04-17 10:14:36 | Longfin Smelt | None | 1 | 18.5 | Larva | Suisun Marsh | Suisun Marsh | West | 20mm | EDSM Provisional DR, USFWS Lodi |
| 2026-04-17 10:14:36 | Longfin Smelt | None | 4 | 19 | Larva | Suisun Marsh | Suisun Marsh | West | 20mm | EDSM Provisional DR, USFWS Lodi |
| 2026-04-17 10:14:36 | Longfin Smelt | None | 1 | 19.2 | Larva | Suisun Marsh | Suisun Marsh | West | 20mm | EDSM Provisional DR, USFWS Lodi |
| 2026-04-17 10:14:36 | Longfin Smelt | None | 1 | 19.5 | Larva | Suisun Marsh | Suisun Marsh | West | 20mm | EDSM Provisional DR, USFWS Lodi |
| 2026-04-17 10:14:36 | Longfin Smelt | None | 1 | 19.9 | Larva | Suisun Marsh | Suisun Marsh | West | 20mm | EDSM Provisional DR, USFWS Lodi |
| 2026-04-17 10:14:36 | Longfin Smelt | None | 1 | 20 | Juvenile | Suisun Marsh | Suisun Marsh | West | 20mm | EDSM Provisional DR, USFWS Lodi |
| 2026-04-17 10:14:36 | Longfin Smelt | None | 1 | 20.3 | Juvenile | Suisun Marsh | Suisun Marsh | West | 20mm | EDSM Provisional DR, USFWS Lodi |
| 2026-04-17 10:14:36 | Longfin Smelt | None | 2 | 20.5 | Juvenile | Suisun Marsh | Suisun Marsh | West | 20mm | EDSM Provisional DR, USFWS Lodi |
| 2026-04-17 10:14:36 | Longfin Smelt | None | 1 | 20.8 | Juvenile | Suisun Marsh | Suisun Marsh | West | 20mm | EDSM Provisional DR, USFWS Lodi |
| 2026-04-17 10:14:36 | Longfin Smelt | None | 1 | 21 | Juvenile | Suisun Marsh | Suisun Marsh | West | 20mm | EDSM Provisional DR, USFWS Lodi |
| 2026-04-17 10:14:36 | Longfin Smelt | None | 1 | 21.4 | Juvenile | Suisun Marsh | Suisun Marsh | West | 20mm | EDSM Provisional DR, USFWS Lodi |
| 2026-04-17 10:14:36 | Longfin Smelt | None | 3 | 22 | Juvenile | Suisun Marsh | Suisun Marsh | West | 20mm | EDSM Provisional DR, USFWS Lodi |
| 2026-04-17 10:14:36 | Longfin Smelt | None | 1 | 22.8 | Juvenile | Suisun Marsh | Suisun Marsh | West | 20mm | EDSM Provisional DR, USFWS Lodi |
| 2026-04-17 10:14:36 | Longfin Smelt | None | 1 | 23.6 | Juvenile | Suisun Marsh | Suisun Marsh | West | 20mm | EDSM Provisional DR, USFWS Lodi |
| 2026-04-17 10:14:36 | Longfin Smelt | None | 1 | 24 | Juvenile | Suisun Marsh | Suisun Marsh | West | 20mm | EDSM Provisional DR, USFWS Lodi |
| 2026-04-17 10:14:36 | Longfin Smelt | None | 9 | NA | Suisun Marsh | Suisun Marsh | West | 20mm | EDSM Provisional DR, USFWS Lodi | |
| 2026-04-21 08:42:23 | Longfin Smelt | None | 1 | 12.5 | Larva | Suisun Marsh | Suisun Marsh | West | 20mm | EDSM Provisional DR, USFWS Lodi |
| 2026-04-21 08:42:23 | Longfin Smelt | None | 1 | 13 | Larva | Suisun Marsh | Suisun Marsh | West | 20mm | EDSM Provisional DR, USFWS Lodi |
| 2026-04-21 08:42:23 | Longfin Smelt | None | 1 | 15.2 | Larva | Suisun Marsh | Suisun Marsh | West | 20mm | EDSM Provisional DR, USFWS Lodi |
| 2026-04-21 08:42:23 | Longfin Smelt | None | 1 | 15.3 | Larva | Suisun Marsh | Suisun Marsh | West | 20mm | EDSM Provisional DR, USFWS Lodi |
| 2026-04-21 08:42:23 | Longfin Smelt | None | 1 | 15.5 | Larva | Suisun Marsh | Suisun Marsh | West | 20mm | EDSM Provisional DR, USFWS Lodi |
| 2026-04-21 08:42:23 | Longfin Smelt | None | 1 | 15.8 | Larva | Suisun Marsh | Suisun Marsh | West | 20mm | EDSM Provisional DR, USFWS Lodi |
| 2026-04-21 08:42:23 | Longfin Smelt | None | 1 | 16 | Larva | Suisun Marsh | Suisun Marsh | West | 20mm | EDSM Provisional DR, USFWS Lodi |
| 2026-04-21 08:42:23 | Longfin Smelt | None | 1 | 17.9 | Larva | Suisun Marsh | Suisun Marsh | West | 20mm | EDSM Provisional DR, USFWS Lodi |
| 2026-04-21 08:42:23 | Longfin Smelt | None | 1 | 18 | Larva | Suisun Marsh | Suisun Marsh | West | 20mm | EDSM Provisional DR, USFWS Lodi |
| 2026-04-21 08:42:23 | Longfin Smelt | None | 1 | 18.2 | Larva | Suisun Marsh | Suisun Marsh | West | 20mm | EDSM Provisional DR, USFWS Lodi |
| 2026-04-21 08:42:23 | Longfin Smelt | None | 1 | 18.4 | Larva | Suisun Marsh | Suisun Marsh | West | 20mm | EDSM Provisional DR, USFWS Lodi |
| 2026-04-21 08:42:23 | Longfin Smelt | None | 1 | 18.5 | Larva | Suisun Marsh | Suisun Marsh | West | 20mm | EDSM Provisional DR, USFWS Lodi |
| 2026-04-21 08:42:23 | Longfin Smelt | None | 1 | 18.9 | Larva | Suisun Marsh | Suisun Marsh | West | 20mm | EDSM Provisional DR, USFWS Lodi |
| 2026-04-21 08:42:23 | Longfin Smelt | None | 1 | 19 | Larva | Suisun Marsh | Suisun Marsh | West | 20mm | EDSM Provisional DR, USFWS Lodi |
| 2026-04-21 08:42:23 | Longfin Smelt | None | 2 | 19.2 | Larva | Suisun Marsh | Suisun Marsh | West | 20mm | EDSM Provisional DR, USFWS Lodi |
| 2026-04-21 08:42:23 | Longfin Smelt | None | 1 | 19.3 | Larva | Suisun Marsh | Suisun Marsh | West | 20mm | EDSM Provisional DR, USFWS Lodi |
| 2026-04-21 08:42:23 | Longfin Smelt | None | 1 | 20.2 | Juvenile | Suisun Marsh | Suisun Marsh | West | 20mm | EDSM Provisional DR, USFWS Lodi |
| 2026-04-21 08:42:23 | Longfin Smelt | None | 1 | 21.5 | Juvenile | Suisun Marsh | Suisun Marsh | West | 20mm | EDSM Provisional DR, USFWS Lodi |
| 2026-04-21 08:42:23 | Longfin Smelt | None | 1 | 23.2 | Juvenile | Suisun Marsh | Suisun Marsh | West | 20mm | EDSM Provisional DR, USFWS Lodi |
| 2026-04-21 08:42:23 | Longfin Smelt | None | 1 | 23.5 | Juvenile | Suisun Marsh | Suisun Marsh | West | 20mm | EDSM Provisional DR, USFWS Lodi |
| 2026-04-21 08:42:23 | Longfin Smelt | None | 1 | 23.6 | Juvenile | Suisun Marsh | Suisun Marsh | West | 20mm | EDSM Provisional DR, USFWS Lodi |
| 2026-04-21 08:58:24 | Longfin Smelt | None | 1 | 16.5 | Larva | Suisun Marsh | Suisun Marsh | West | 20mm | EDSM Provisional DR, USFWS Lodi |
| 2026-04-21 08:58:24 | Longfin Smelt | None | 3 | 17 | Larva | Suisun Marsh | Suisun Marsh | West | 20mm | EDSM Provisional DR, USFWS Lodi |
| 2026-04-21 08:58:24 | Longfin Smelt | None | 3 | 18 | Larva | Suisun Marsh | Suisun Marsh | West | 20mm | EDSM Provisional DR, USFWS Lodi |
| 2026-04-21 08:58:24 | Longfin Smelt | None | 2 | 19 | Larva | Suisun Marsh | Suisun Marsh | West | 20mm | EDSM Provisional DR, USFWS Lodi |
| 2026-04-21 08:58:24 | Longfin Smelt | None | 3 | 20 | Juvenile | Suisun Marsh | Suisun Marsh | West | 20mm | EDSM Provisional DR, USFWS Lodi |
| 2026-04-21 08:58:24 | Longfin Smelt | None | 1 | 20.8 | Juvenile | Suisun Marsh | Suisun Marsh | West | 20mm | EDSM Provisional DR, USFWS Lodi |
| 2026-04-21 08:58:24 | Longfin Smelt | None | 2 | 21 | Juvenile | Suisun Marsh | Suisun Marsh | West | 20mm | EDSM Provisional DR, USFWS Lodi |
| 2026-04-21 08:58:24 | Longfin Smelt | None | 1 | 21.5 | Juvenile | Suisun Marsh | Suisun Marsh | West | 20mm | EDSM Provisional DR, USFWS Lodi |
| 2026-04-21 08:58:24 | Longfin Smelt | None | 1 | 22.5 | Juvenile | Suisun Marsh | Suisun Marsh | West | 20mm | EDSM Provisional DR, USFWS Lodi |
| 2026-04-21 08:58:24 | Longfin Smelt | None | 1 | 24 | Juvenile | Suisun Marsh | Suisun Marsh | West | 20mm | EDSM Provisional DR, USFWS Lodi |
| 2026-04-21 09:39:26 | Longfin Smelt | None | 1 | 13 | Larva | Suisun Marsh | Suisun Marsh | West | 20mm | EDSM Provisional DR, USFWS Lodi |
| 2026-04-21 09:39:26 | Longfin Smelt | None | 1 | 19 | Larva | Suisun Marsh | Suisun Marsh | West | 20mm | EDSM Provisional DR, USFWS Lodi |
| 2026-04-21 09:53:37 | Longfin Smelt | None | 1 | 13.9 | Larva | Suisun Marsh | Suisun Marsh | West | 20mm | EDSM Provisional DR, USFWS Lodi |
| 2026-04-21 09:53:37 | Longfin Smelt | None | 1 | 16 | Larva | Suisun Marsh | Suisun Marsh | West | 20mm | EDSM Provisional DR, USFWS Lodi |
| 2026-04-21 09:53:37 | Longfin Smelt | None | 1 | 19.2 | Larva | Suisun Marsh | Suisun Marsh | West | 20mm | EDSM Provisional DR, USFWS Lodi |
| 2026-04-21 09:53:37 | Longfin Smelt | None | 1 | 19.6 | Larva | Suisun Marsh | Suisun Marsh | West | 20mm | EDSM Provisional DR, USFWS Lodi |
| 2026-04-21 09:53:37 | Longfin Smelt | None | 1 | 21.8 | Juvenile | Suisun Marsh | Suisun Marsh | West | 20mm | EDSM Provisional DR, USFWS Lodi |
| 2026-04-21 10:15:40 | Longfin Smelt | None | 1 | 14.5 | Larva | Suisun Marsh | Suisun Marsh | West | 20mm | EDSM Provisional DR, USFWS Lodi |
| 2026-04-22 07:53:19 | Longfin Smelt | None | 1 | 12 | Larva | Confluence | Suisun Bay | West | 20mm | EDSM Provisional DR, USFWS Lodi |
| 2026-04-22 07:53:19 | Longfin Smelt | None | 1 | 13 | Larva | Confluence | Suisun Bay | West | 20mm | EDSM Provisional DR, USFWS Lodi |
| 2026-04-22 07:53:19 | Longfin Smelt | None | 1 | 14 | Larva | Confluence | Suisun Bay | West | 20mm | EDSM Provisional DR, USFWS Lodi |
| 2026-04-22 07:53:19 | Longfin Smelt | None | 1 | 15 | Larva | Confluence | Suisun Bay | West | 20mm | EDSM Provisional DR, USFWS Lodi |
| 2026-04-22 07:53:19 | Longfin Smelt | None | 1 | 17 | Larva | Confluence | Suisun Bay | West | 20mm | EDSM Provisional DR, USFWS Lodi |
| 2026-04-22 07:53:19 | Longfin Smelt | None | 1 | 20 | Juvenile | Confluence | Suisun Bay | West | 20mm | EDSM Provisional DR, USFWS Lodi |
| 2026-04-22 07:53:19 | Longfin Smelt | None | 1 | 21 | Juvenile | Confluence | Suisun Bay | West | 20mm | EDSM Provisional DR, USFWS Lodi |
| 2026-04-22 08:10:37 | Longfin Smelt | None | 1 | 16.2 | Larva | Confluence | Suisun Bay | West | 20mm | EDSM Provisional DR, USFWS Lodi |
| 2026-04-22 08:10:37 | Longfin Smelt | None | 1 | 23.5 | Juvenile | Confluence | Suisun Bay | West | 20mm | EDSM Provisional DR, USFWS Lodi |
| 2026-04-22 08:51:21 | Longfin Smelt | None | 1 | 11.5 | Larva | West Suisun Bay | Suisun Bay | Far West | 20mm | EDSM Provisional DR, USFWS Lodi |
| 2026-04-22 10:54:26 | Longfin Smelt | None | 1 | 16.4 | Larva | West Suisun Bay | Suisun Bay | Far West | 20mm | EDSM Provisional DR, USFWS Lodi |
| 2026-04-22 10:54:26 | Longfin Smelt | None | 1 | 24.6 | Juvenile | West Suisun Bay | Suisun Bay | Far West | 20mm | EDSM Provisional DR, USFWS Lodi |
Salvage at the SWP and CVP Delta Fish Facilities
| samptimestamp | facility | name | adiposeclip | count_duration | pumping_duration | sample_fraction | study_type | length | life stage | sex | nfish |
|---|---|---|---|---|---|---|---|---|---|---|---|
| 2026-03-06 18:00:00 | CVP | Delta | f | 30 | 120 | 0.25 | Normal count | 65 | Adult | 1 |
Hourly Table
| Date | Hour | River Discharge Flow Old River at Bacon Island (USGS) (CFS) [CDEC:OBI] | River Discharge Flow Old River at Highway 4 (CFS) [CDEC:OH4] |
|---|---|---|---|
| Date | Hour | River Discharge Flow Old River at Bacon Island (USGS) (CFS) [CDEC:OBI] | River Discharge Flow Old River at Highway 4 (CFS) [CDEC:OH4] |
| 2026-04-24 | 0 | -7410.00 | |
| 2026-04-24 | 1 | -7630.00 | |
| 2026-04-24 | 2 | -8690.00 | -6490.00 |
| 2026-04-24 | 3 | -1340.00 | -3770.00 |
| 2026-04-24 | 4 | 4480.00 | 956.00 |
| 2026-04-24 | 5 | 6620.00 | 4610.00 |
| 2026-04-24 | 6 | 5110.00 | 3050.00 |
| 2026-04-24 | 7 | -1330.00 | 183.00 |
| 2026-04-24 | 8 | -9240.00 | -4360.00 |
| 2026-04-24 | 9 | -5950.00 | |
| 2026-04-24 | 10 | -6210.00 | |
| 2026-04-24 | 11 | -6710.00 | |
| 2026-04-24 | 12 | -6870.00 | -5720.00 |
| 2026-04-24 | 13 | 2260.00 | -2070.00 |
| 2026-04-24 | 14 | 8880.00 | 4020.00 |
| 2026-04-24 | 15 | 11400.00 | 6690.00 |
| 2026-04-24 | 16 | 11600.00 | 7210.00 |
| 2026-04-24 | 17 | 10700.00 | 6500.00 |
| 2026-04-24 | 18 | 10100.00 | 6110.00 |
| 2026-04-24 | 19 | 9550.00 | 5740.00 |
| 2026-04-24 | 20 | 7100.00 | 5480.00 |
| 2026-04-24 | 21 | -1560.00 | 3690.00 |
| 2026-04-24 | 22 | -2900.00 | |
| 2026-04-24 | 23 | -6430.00 | |
| 2026-04-25 | 0 | -7730.00 | |
| 2026-04-25 | 1 | -8240.00 | |
| 2026-04-25 | 2 | -8230.00 | |
| 2026-04-25 | 3 | -8430.00 | -7030.00 |
| 2026-04-25 | 4 | 618.00 | -3950.00 |
| 2026-04-25 | 5 | 6140.00 | 1600.00 |
| 2026-04-25 | 6 | 8170.00 | 4990.00 |
| 2026-04-25 | 7 | 6730.00 | 3090.00 |
| 2026-04-25 | 8 | 3130.00 | 2100.00 |
| 2026-04-25 | 9 | -5560.00 | -1040.00 |
| 2026-04-25 | 10 | -5940.00 | |
| 2026-04-25 | 11 | -6010.00 | |
| 2026-04-25 | 12 | -6410.00 | |
| 2026-04-25 | 13 | -9870.00 | -6340.00 |
| 2026-04-25 | 14 | -2120.00 | -4260.00 |
| 2026-04-25 | 15 | 5550.00 | 1360.00 |
| 2026-04-25 | 16 | 9820.00 | 5930.00 |
| 2026-04-25 | 17 | 10600.00 | 7000.00 |
| 2026-04-25 | 18 | 10700.00 | 7310.00 |
| 2026-04-25 | 19 | 10600.00 | 7220.00 |
| 2026-04-25 | 20 | 9720.00 | 6560.00 |
| 2026-04-25 | 21 | 6360.00 | 5610.00 |
| 2026-04-25 | 22 | -3540.00 | 3420.00 |
| 2026-04-25 | 23 | -3430.00 | |
| 2026-04-26 | 0 | -6410.00 | |
| 2026-04-26 | 1 | -7550.00 | |
| 2026-04-26 | 2 | -8370.00 | |
| 2026-04-26 | 3 | -7890.00 | |
| 2026-04-26 | 4 | -4270.00 | -6400.00 |
| 2026-04-26 | 5 | 3760.00 | -1350.00 |
| 2026-04-26 | 6 | 8130.00 | 4210.00 |
| 2026-04-26 | 7 | 9180.00 | 5560.00 |
| 2026-04-26 | 8 | 7970.00 | 4640.00 |
| 2026-04-26 | 9 | 5580.00 | 4220.00 |
| 2026-04-26 | 10 | -1110.00 | 2460.00 |
| 2026-04-26 | 11 | -9950.00 | -3290.00 |
| 2026-04-26 | 12 | -5400.00 | |
| 2026-04-26 | 13 | -6220.00 | |
| 2026-04-26 | 14 | -6340.00 | |
| 2026-04-26 | 15 | -5170.00 | -5320.00 |
| 2026-04-26 | 16 | 3080.00 | -899.00 |
| 2026-04-26 | 17 | 8200.00 | 4710.00 |
| 2026-04-26 | 18 | 9550.00 | 6350.00 |
| 2026-04-26 | 19 | 9800.00 | 5810.00 |
| 2026-04-26 | 20 | 9080.00 | 5030.00 |
| 2026-04-26 | 21 | 7520.00 | 4110.00 |
| 2026-04-26 | 22 | 2840.00 | 3520.00 |
| 2026-04-26 | 23 | -7510.00 | 1050.00 |
| 2026-04-27 | 0 | -4930.00 | |
| 2026-04-27 | 1 | -6970.00 | |
| 2026-04-27 | 2 | -8150.00 | |
| 2026-04-27 | 3 | -8440.00 | |
| 2026-04-27 | 4 | -7900.00 | |
| 2026-04-27 | 5 | -1190.00 | -5230.00 |
| 2026-04-27 | 6 | 6300.00 | 1010.00 |
| 2026-04-27 | 7 | 9430.00 | 6030.00 |
| 2026-04-27 | 8 | 10200.00 | 5690.00 |
| 2026-04-27 | 9 | 8470.00 | 4820.00 |
| 2026-04-27 | 10 | 6410.00 | 4400.00 |
| 2026-04-27 | 11 | -253.00 | 3020.00 |
| 2026-04-27 | 12 | -9120.00 | -1820.00 |
| 2026-04-27 | 13 | -5100.00 | |
| 2026-04-27 | 14 | -6720.00 | |
| 2026-04-27 | 15 | -6730.00 | |
| 2026-04-27 | 16 | -6210.00 | -5670.00 |
| 2026-04-27 | 17 | 2010.00 | -1800.00 |
| 2026-04-27 | 18 | 7600.00 | 4030.00 |
| 2026-04-27 | 19 | 9580.00 | 6490.00 |
| 2026-04-27 | 20 | 9000.00 | 5530.00 |
| 2026-04-27 | 21 | 8400.00 | 4910.00 |
| 2026-04-27 | 22 | 6200.00 | 4090.00 |
| 2026-04-27 | 23 | -1330.00 | 2820.00 |
| 2026-04-28 | 0 | -9750.00 | -2340.00 |
| 2026-04-28 | 1 | -6200.00 | |
| 2026-04-28 | 2 | -7520.00 | |
| 2026-04-28 | 3 | -8350.00 | |
| 2026-04-28 | 4 | -8310.00 | |
| 2026-04-28 | 5 | -5470.00 | -6810.00 |
| 2026-04-28 | 6 | 3790.00 | -1950.00 |
| 2026-04-28 | 7 | 8710.00 | 4520.00 |
| 2026-04-28 | 8 | 10300.00 | 6820.00 |
| 2026-04-28 | 9 | 9470.00 | 4230.00 |
| 2026-04-28 | 10 | 7510.00 | 3040.00 |
| 2026-04-28 | 11 | 5670.00 | 2430.00 |
| 2026-04-28 | 12 | -564.00 | 3450.00 |
| 2026-04-28 | 13 | -9110.00 | -543.00 |
| 2026-04-28 | 14 | -5260.00 | |
| 2026-04-28 | 15 | -6840.00 | |
| 2026-04-28 | 16 | -7460.00 | |
| 2026-04-28 | 17 | -7580.00 | -6140.00 |
| 2026-04-28 | 18 | 1150.00 | -2600.00 |
| 2026-04-28 | 19 | 7010.00 | 2850.00 |
| 2026-04-28 | 20 | 9230.00 | 5400.00 |
| 2026-04-28 | 21 | 8430.00 | 5680.00 |
| 2026-04-28 | 22 | 7260.00 | 5420.00 |
| 2026-04-28 | 23 | 3730.00 | 4480.00 |
| 2026-04-29 | 0 | -6220.00 | 1570.00 |
| 2026-04-29 | 1 | -4920.00 | |
| 2026-04-29 | 2 | -7120.00 | |
| 2026-04-29 | 3 | -8290.00 | |
| 2026-04-29 | 4 | -8730.00 | |
| 2026-04-29 | 5 | -8140.00 | |
| 2026-04-29 | 6 | -109.00 | -5190.00 |
| 2026-04-29 | 7 | 7420.00 | 1890.00 |
| 2026-04-29 | 8 | 10400.00 | 6170.00 |
| 2026-04-29 | 9 | 10700.00 | 5500.00 |
| 2026-04-29 | 10 | 9040.00 | 4330.00 |
| 2026-04-29 | 11 | 7760.00 | 3660.00 |
| 2026-04-29 | 12 | 5160.00 | 4080.00 |
| 2026-04-29 | 13 | -1470.00 | 4270.00 |
| 2026-04-29 | 14 | -9560.00 | -1370.00 |
| 2026-04-29 | 15 | -5630.00 | |
| 2026-04-29 | 16 | -6930.00 | |
| 2026-04-29 | 17 | -7230.00 | |
| 2026-04-29 | 18 | -8480.00 | -6260.00 |
| 2026-04-29 | 19 | 464.00 | -3320.00 |
| 2026-04-29 | 20 | 5700.00 | 2000.00 |
| 2026-04-29 | 21 | 8000.00 | 4630.00 |
| 2026-04-29 | 22 | 7670.00 | 5170.00 |
| 2026-04-29 | 23 | 5910.00 | 4840.00 |
| 2026-04-30 | 0 | -865.00 | 3430.00 |
| 2026-04-30 | 1 | -9450.00 | -2080.00 |
| 2026-04-30 | 2 | -6560.00 | |
| 2026-04-30 | 3 | -7680.00 | |
| 2026-04-30 | 4 | -8450.00 | |
| 2026-04-30 | 5 | -8440.00 | |
| 2026-04-30 | 6 | -3730.00 | -6570.00 |
| 2026-04-30 | 7 | 5190.00 | -324.00 |
| 2026-04-30 | 8 | 10400.00 | 6020.00 |
| 2026-04-30 | 9 | 11100.00 | 7670.00 |
| 2026-04-30 | 10 | 10500.00 | 5940.00 |
| 2026-04-30 | 11 | 9390.00 | 4860.00 |
| 2026-04-30 | 12 | 7820.00 | 4000.00 |
| 2026-04-30 | 13 | 4040.00 | 3600.00 |
| 2026-04-30 | 14 | -5050.00 | 3270.00 |
| 2026-04-30 | 15 | -3130.00 | |
| 2026-04-30 | 16 | -6430.00 | |
| 2026-04-30 | 17 | -7040.00 | |
| 2026-04-30 | 18 | -7400.00 | |
| 2026-04-30 | 19 | -7500.00 | -6450.00 |
| 2026-04-30 | 20 | 1230.00 | -3070.00 |
| 2026-04-30 | 21 | 6790.00 | 2190.00 |
| 2026-04-30 | 22 | 8070.00 | 4540.00 |
| 2026-04-30 | 23 | 6840.00 | 4890.00 |
Data Notes & Resources
Content on this page is updated daily and includes the most up-to-date datasets contained in the SacPAS database.
Smelt Monitoring
The Enhanced Delta Smelt Monitoring Program (EDSM) Weekly Summary, USFWS Lodi. Data are preliminary and are subject to correction and revision.
Smelt Surveys Current and Historical
Current and Historical Delta Smelt Surveys query, HTML table and CSV.
Annually updated Historical Delta Smelt Combined Sampling by Stratum plots removed until further review.
Data Notes
- We obtain Enhanced Delta Smelt Monitoring (EDSM) Provisional data from Delta Juvenile Fish Monitoring Program, USFWS Lodi Office; data are preliminary and are subject to correction and revision. Please see the Environmental Data Initiative (EDI) Portal Interagency Ecological Program and US Fish and Wildlife Service: San Francisco Estuary Enhanced Delta Smelt Monitoring Program data for the finalized dataset.
- We obtain salvage data from Fish Salvage Monitoring, CDFW Bay Delta Region
- Salvage Database, https://filelib.wildlife.ca.gov/Public/Salvage/
- We obtain Delta Operations (single day and running 30 day reports) from Operations and Delta Status, California Department of Water Resources. SacPAS has archived this data since October 2016.
- "QWEST", "NDOI", "E/I Ratio 3-day", and "Rio Vista Flow" from the Delta Status and Operations, Hydrologic Conditions Summary (daily).
- "X2 Position": Data from the Delta Status and Operations, Delta Operations Summary (daily). For plotting purposes, SacPAS substitutes ">81km" with "82" and "<56km" with "55".
- On a daily basis, SacPAS calculates "OMR Index", "OMR Index 5-day", and "OMR Index 14-day" based on methods as described in:
California Department of Water Resources (DWR). 2017. Old and Middle River Flow Review: USGS Gauge Readings versus Index Calculations for 2011 through 2017.
See OMR Tidally Filtered Flow and Index Calculations as performed by SacPAS for full details. SacPAS calculated OMR Index is available for 28 October 2016 to the present. - On a daily basis, we download event, hourly, and daily data from California Data Exchange Center (CDEC) for select parameters and sites for inclusion in the SacPAS database.
- As of 2024-12-06, daily averages for CDEC stations and parameters on this webpage, exclusively, are daily averages as published by CDEC. Missing CDEC daily averages are filled by SacPAS from CDEC data where event- or hourly-timescale data are available (using hours 01-24 in local time). A correction to our process was implemented on 2025-01-14.
- We obtain Chipps Island Trawl catch data daily.
- Life stage is applied to catch based on fork length (mm).
- Delta Smelt
- Larva: < 20mm
- Juvenile: 20-58mm
- Adult: > 58mm
- Longfin Smelt
- Larva: < 20mm
- Juvenile: 20-84mm
- Adult: > 84mm
- Delta Smelt